With the care village market still very much in its infancy in the UK, perhaps two of the biggest questions facing every care village developer, investor and operator are: How much can we sell our care village apartments for, and will they hold their value? Carterwood director Ben Hartley provides some answers.
Despite strong sales rates and a demand that is tending to outstrip supply, the UK is home to just 4,535 private older person’s housing schemes[1] including 124 care villages.[2] This creates a distinct lack of direct comparable evidence to support recommended apartment sales rates within a typical care village catchment area.
Investing in and developing care villages has thus become as much art as science. As market analysis experts, this – as you might expect – makes us a bit twitchy. We base our recommendations and decisions on the best available data; not a whim. We have therefore collated sales data for England’s care villages’ individual unit sales information over the last 10 years.[3] We have also obtained sales data for 4,922 private leasehold sale apartments from these care villages. This new and unique dataset gives us a picture of the apartment sales rates (on a per sq. ft basis) being achieved by care villages year on year, based on land registry sold price data.
“This new and unique dataset gives us a picture of the apartment sales rates (both capital values and rates per sq. ft) being achieved by care villages year on year.”
In addition to this, we’ve profiled each care village site in terms of wealth, demographics and target market. For sites where there is a lack of direct comparable evidence, we can analyse the profiles of existing care villages against locations with similar wealth characteristics, which is an invaluable tool in instances where there is limited or no local evidence.
The importance of determining apartment sales rates early
Determining apartment sales rates at an early stage is important to improve decision making. It allows more accurate identification of the profile and size of the potential target market to assist with the care village’s market positioning and construction specification. A high target sales rate not only requires an affluent underlying wealth profile, but also necessitates the incorporation of luxury fixtures and fittings, as well as premium communal facilities.
Above all, unit sales rates for a new care village development impact directly upon how much a developer can bid for each site; sales rates are the key driver of land value for a new development. Early advice may help secure a site with the confidence that projected sales rates are achievable.
What does the new Carterwood care village data show?
Across the entire dataset during 2017/18 care village apartments sold across England were of an average size of 854 sq. ft, with an average capital price of £352,000. This equates to an average sales rate of £412 per sq. ft.
We have identified several significant findings, three of which we have considered in turn below:
- Strong sales rate performance for schemes targeting the top-end of the market;
- Marked regional differences in apartment sales velocity/sales rates;
- An overall sales rate increase of 37 per cent over the last 10 years.
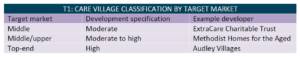
To assist the reader, we have classified schemes in our dataset into three types based upon the development specification and target market of the development, which is summarised in Table 1. The classification of the target market is very important as it affects several variables including the specification, unit size, pricing points, land value, catchment area, market characteristics and, ultimately, the viability of any new development.
Source: Carterwood Analytics.
We have adopted this classification to ensure that we can compare individual schemes accurately and appropriately to their target markets.
Strong sales rates performance at the top-end of the market
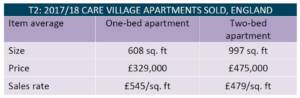
At the top-end of the market (comprising 44 schemes), our data shows that during 2017/2018 care village apartments sold across England were of an average size of 923 sq. ft with an average capital price of £447,000. This equates to an average sales rate of £492 per sq. ft.
Table 2 shows the differences between one- and two-bed apartments sold in villages targeting the top end of the market. Sales rates during the period were very strong at the top-end reflecting the strong appetite for the product and high quality of the developments.
Source: Land Registry; Carterwood Analytics, EPC Register.
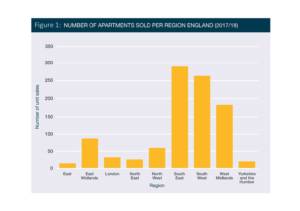
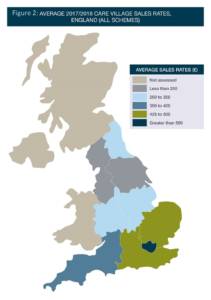
Marked regional differences in apartments sales and sales rates
As expected, there are marked regional differences in both the number of apartments sold per region (see Figure 1) and the average sales rates (see Figure 2).
In this dataset, we have included all units regardless of the target market, from middle-market products to the very top-end.
Source: Land Registry; Carterwood Analytics.
Source: Land Registry; Carterwood Analytics, EPC Register.
In 2017 / 2018, the South East outperformed any other region. It had 23 schemes with sold units, equating to just over a quarter (27%) of the total sample size. Units across the South East achieved an above average sales rate of £461/sq. ft across all scheme types. The fact that more care village apartments are selling in the South East than any other region reflects the strong wealth profile, demand in the area and concentration of development activity in this region.
Care village apartment sales rates have increased 37% over 10 years
The evidence indicates that, overall, care village apartments tend to hold their values and broadly track general house price inflation.
What’s more, sales are managed in-house by expert sales and marketing teams who understand the target market and provide an informative insight into life at the village. Management teams additionally have a permanent, reassuring onsite presence with excellent scheme knowledge. To assist buyers of both new and resale properties,
many operators also leverage incentives such as part-exchange and removals, as well as decluttering services.
Most care villages charge event fees that provide the necessary funds for ongoing maintenance, ensuring the grounds and facilities are well presented and up to date. These fees also secure adequate reinvestment into facilities to protect the long-term value of the apartments and optimise resale values.
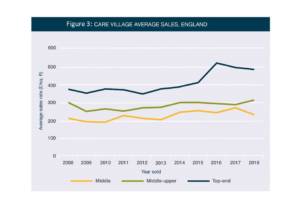
Figure 3 compares overall care village sales rates averages in England over the last 10 years. We have separated out the data into the three target markets. Typically, sales rates have been more buoyant at the top-end of the market, with the more affordable middle market showing limited sales rate growth over time. While this gives a general picture, analysis can be undertaken on individual developments to give a more detailed picture of scheme-specific circumstances.
Source: Land Registry; Carterwood Analytics, EPC Register.
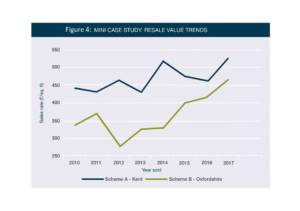
To further our understanding of England’s care village market, we have also compared the achieved sales rates year on year, from 2010 to 2017, for two schemes – one in Kent (57 apartment sales) and one in Oxfordshire (122 apartment sales). As shown in Figure 4, the average resales show large fluctuations, which is a result of smaller samples during some years. For example, for Scheme A in 2012, we only have evidence of one resale. However, despite the limited data, the trend shows an overall increase in sales rates for both schemes.
Source: Land Registry; Carterwood Analytics, EPC Register.
One further contributory factor to the rise in sales rates is that care villages tend to be phased, with each release being limited and new phases being released only after the previous one has sold out. In an improving market, this leads to sales rate increases and differs from most standalone retirement schemes where often all stock is released at once. Also, typically, the better plots sell first, with the less desirable units remaining and being less likely to benefit from time-related sales rate inflation.
The bottom line
The new Carterwood care village sales data is an essential resource for improving understanding of the care village market and assisting strategic decision making, notwithstanding the multitude of factors that come into play when determining sales rates and value retention.
Greater sensitivity to capital pricing points in the local area can be achieved by a more detailed analysis, with consideration of aspects such as scheme size, apartment sizes and specification, operator, immediate setting, level/effectiveness of marketing and projected sales velocity.
This article first appeared in the November 2018 issue of HealthInvestor.
[1] Source: Carterwood Analytics and EAC Housing Options (Housing LIN) – all models.
[2] Based upon the EAC definition of a care village.
[3] We have currently analysed 85 care villages in England that meet our in-house definition of a care village.