Where are the opportunities in care homes and retirement living? Carterwood’s director Tom Hartley and principal analyst Aishling Barrett analyse the sector’s supply and demand.
With the proportion of people requiring care set to increase, the development of new care home and older people’s housing facilities has never been more critical. When assessing a market for development there are a whole host of things to consider: Is there a demand in this location? Is there sufficient wealth to drive average fees and an appropriate return on my investment? Is the existing competition in the local area significant? But while these factors are undoubtably important, markets are not static, and the potential competitive threat within the planning system is also a key consideration when assessing the future opportunity.
Carterwood has been assessing markets and improving decision making in the healthcare sector for over 10 years. But in 2018, we took on one of our biggest research projects to date: could we build a live database of all the planned schemes in the United Kingdom for care homes and older people’s housing? The answer was yes.
With over 1,000 hours of research, the initial project – to investigate every planned scheme under the use class C2 in the UK, both care homes and specific accommodation for older people, since 2015 and build a picture of the development pipeline across the country – has been completed. Of course, work is ongoing, given the dynamic dataset, but read on for a snapshot of what the results so far can tell us.
The current national shortfall of market standard bedspaces, that being a care home bedroom with an en-suite WC and wash hand basin as minimum, is within the region of 100,000 but is set to increase to 166,000 by 2029. And the numbers are even greater with regard to older people’s housing, with a shortfall of 204,000 private extra care units in 2019 set to increase to 240,000 by 2029.
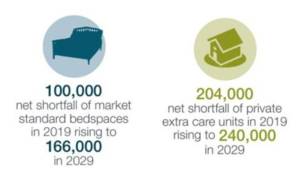
Figure 1: estimated shortfall of care home bedspaces and private extra care units for older people on a nationwide basis
Our dataset of planning applications for the UK, from April 2015 to March 2018, indicates that nearly 40,000 market standard care home beds were granted permission in the last 3 years, in addition to almost 24,000 private units within older people’s housing schemes. This includes both new build schemes and extensions to existing facilities.
But given the number of applications submitted, the percentage of schemes that make it to completion is surprisingly small. Just a quarter of care home and a third of older people’s housing applications submitted in 2015 are now operational. Many residential and commercial developers have taken note of the opportunities and potential returns available in the care sector in recent years, and we have witnessed more speculative applications submitted, which account for a proportion of the undeveloped applications. Furthermore, housebuilders are more consistently including some element of C2 accommodation within their masterplans, not always with the intention of delivering these plots to end users.
The ’who’ is important
When evaluating the likelihood of development, the identity of the applicant is crucial. For care home applications, Top 20 operators by size make up only 7% of all new-build submissions, but decisions are made 20% quicker on these applications, and nearly twice as many Top 20 schemes get developed. For older people’s housing this is even more pronounced, with the Top 20 making up 34% of all submitted applications. In addition, over five times as many Top 20 older people’s housing schemes submitted in 2015 were developed as those submitted by other applicants, evidencing the speculative nature of many applications and the small number of established operators.
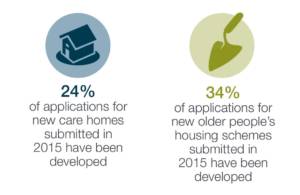
Figure 2: percentage of applications that have been developed
What’s being developed?
So, what do we know about these care home permissions? Well, over 200 planning applications for new build care homes are submitted each year, and consistently just over 80% of these are granted permission. There is also a trend towards larger care homes entering the market, with almost two-thirds of new build applications submitting for the development of between 61 and 90 bedspaces. Although, with lease up periods increasing as operators target higher private fee rates, the trend is heading more toward schemes of between 61 and 70 beds in all but heavily under-supplied markets. Conversely, the spread of scheme sizes across older people’s housing applications is vast, with a greater number of schemes of 10 units or fewer than there are those with over 100 units. As care village operators become more established and intensify their development programmes, we expect larger schemes to become more common. Likewise, we still expect to see many schemes of between 40 and 80 units from those developers providing higher density, standalone schemes with more limited communal facilities.
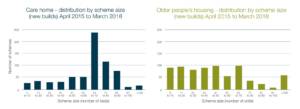
Figure 3: distribution in scheme by size
Where is the future supply concentrated?
Within our three-year dataset are over 500 new build care home applications that have been granted permission, a fifth of which are located in the South East. By comparison just 5% of granted new build care home applications are located in Wales and Northern Ireland combined. But while the number of schemes located in the South East has remained more or less consistent over time, we see continued growth in care home applications located in the South West and North West, as developers, operators and investors look further afield as the South East is becoming increasingly competitive and operators prove that high fees can be achieved elsewhere.
The distribution of granted older people’s housing schemes is similar in nature, with 24% of schemes located in the South East and 16% in the South West, but with growth also evident in the East of England and the East Midlands. Older people’s housing schemes are more likely to be granted in the East of England and East Midlands of anywhere in England and Wales, although Northern Ireland and Scotland also have high success rates for applications of this type.
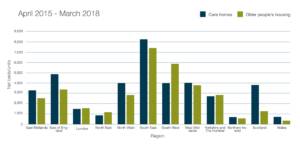
Figure 4: regional distribution of consented bedspaces/ units
Barriers to entry
While success rates for older people’s housing schemes are high in the East Midlands, the journey from submission to decision is a long one. Older people’s housing applications in this region take an average of nine and a half months to be granted permission, albeit the average time taken to reach a decision has actually reduced over the years. Nationally, the average time taken for older people’s housing schemes to get permission is just over eight months from application validation to decision date, while care home applications are typically decided more speedily, at just under seven months, both excluding the pre-application and judicial review period.
For care home applications, historically, the quickest decisions are made in Wales and the South West, within an average of five months and, while the absolute number of care home permissions granted in Wales is small, it also has one of the highest proportions of care home development when related to the number of applications submitted. Schemes in London, however, struggle to materialise, with just four care home applications having been built out within our dataset. By contrast, the South East has the largest absolute number of C2 applications of any region in the UK and also the largest number of schemes reaching development, with over 60 C2 schemes that were submitted since the start of 2015 having now been built out, two-thirds of which were older people’s housing schemes.
Case studies – Cheshire and Essex
Let us introduce you to Poynton, a small town located 5 miles south of Stockport in the commuter belt of Manchester. The town marries together high levels of demand from the densely populated areas to the north east with attractively high average house prices in the local area. As things stand, the Poynton market displays an exceptionally large shortfall of market standard bedspaces. The town is similar in many regards to Rochford in Essex, which demonstrates an existing shortfall of almost 900 market standard beds. Yet while there is only one small extension planned within the Rochford market, submitted planning within the area of Poynton reduces the potential shortfall of beds by half, with four planned new build schemes submitted since 2015 and a further three extensions planned to increase the capacity of existing care homes.
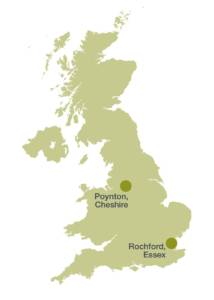
Figure 5: case study locations
Now, as we have already discussed, the percentage of planned schemes that reach completion is low; however, the sheer volume of planned beds in this market fundamentally alters the risk associated with it when assessing locations for potential investment, demonstrating the importance of utilising this data in decision making.
Key opportunities and investment considerations
The future is positive for care home and older people’s housing development. While the market remains competitive in the South East, with a high number of existing and planned schemes, there is still much untapped potential in this area. We are also seeing more activity across alternative regions where there is, in some cases, arguably, a bigger market and increased evidence of strong fee rates. While the Top 20 continue to excel within the planning system, we expect speculative applicants to remain keen to reap the rewards other are gaining from successful developments. There is more than enough demand to support continued development and investment within this sector in all but a very small number of areas.
The future supply is a key consideration in any development proposal as it is likely to form the strongest competition in the catchment area. While some parts of the country have experienced significant numbers of planning applications in recent years, we now know that this doesn’t always translate into new schemes being developed. Where there are new schemes, timing is critical; even in a market with high planned supply, a new scheme can still succeed if the opening and initial recruitment drive for staff and residents is well-staggered. Of course, risk can always be mitigated with intelligent positioning within the market, optimising categories of care and setting realistic expectations for achievable fees, sales rates (per sq. ft) and fill rates to take advantage of even small gaps in the market around the UK, and understanding the planned supply is a critical factor in this.
This article first appeared in the March 2019 issue of HealthInvestor.
Contact information
Tel: 08458 690777
Email: info@carterwood.co.uk
Sources of statistics: A-Z Care Homes Guide, Carterwood Analytics, relevant local planning authorities, Census 2011, www.housingcare.org, Housing LIN, Office for National Statistics.