This is the first in a series of four articles that will each focus on a different aspect of Carterwood’s updated and significantly expanded research into self-funded fee rates across Great Britain. This week we share the overall key findings and then dive into an exploration of how self-funded fees vary by geography. Carterwood’s analysis of self-funded fee data was undertaken by Ben Hartley (director) and Jessica Stainthorp (senior analyst).
Future instalments, which will be published once a week for the next three weeks, will highlight how average fees for nursing and personal care vary by CQC rating, year of first registration, and dementia care offering.
If you would like to request a copy of our full research report in PDF format, please contact Tom Hartley (director) on tom.hartley@carterwood.co.uk or 07715 495062.
Background
The COVID-19 pandemic has exacerbated a series of historic challenges facing the adult social care sector and, despite reacting quickly and effectively to minimise the impact from the virus, operators are still burdened by increased costs and below-average occupancy rates.
We’re pleased to see that occupancy is recovering across the board, yet remain wary of the impact of subsequent waves of the virus over the coming months
Alongside the challenges posed by COVID-19, the sector also still lacks a reformed legislative framework to fix the funding of long-term care. Over time, the introduction of the National Minimum / Living Wage, the uncertainty caused by Brexit and ongoing acute staffing shortages, have all also had a big impact on operating margins.
If our sector is going to be able to adapt to the challenges it faces now and prosper in the future, the robustness of the self-funding market remains central to its long-term viability given the consistently disappointing fee rates on offer from all but a handful of local authorities. We believe that access to accurate self-funded fee data is essential in helping care homes to benchmark their fees and make their businesses more resilient at this challenging time.
In July 2020, we released our preliminary research into elderly care home self-funded fee rates. It focused on approximately 3,000 homes with 30 or more beds in Scotland and the southern regions of England, and revealed unique insights into how fee rates vary when factors such as regulatory rating, year of first registration and dementia care provision are considered.
Over the past two months we have dramatically expanded this dataset to cover 9,000+ homes, equating to 89% of the elderly care homes in Great Britain that accept self-funded referrals. The breadth and depth of this dataset is unrivalled, and all fee rates have been collected since May 2020. This enables us to demonstrate the self-funded fee dynamics at play across Great Britain with remarkable clarity.
The immense pressures of the past six months have fundamentally changed the elderly care home market. The purpose of this research is, within its narrow focus on fees, to equip care home operators with robust, reliable data that helps them to adapt to the new world we find ourselves in.
To ensure this data remains current in a market that’s never been more dynamic, we also endeavour to update our entire fee dataset in early 2021.
Key findings
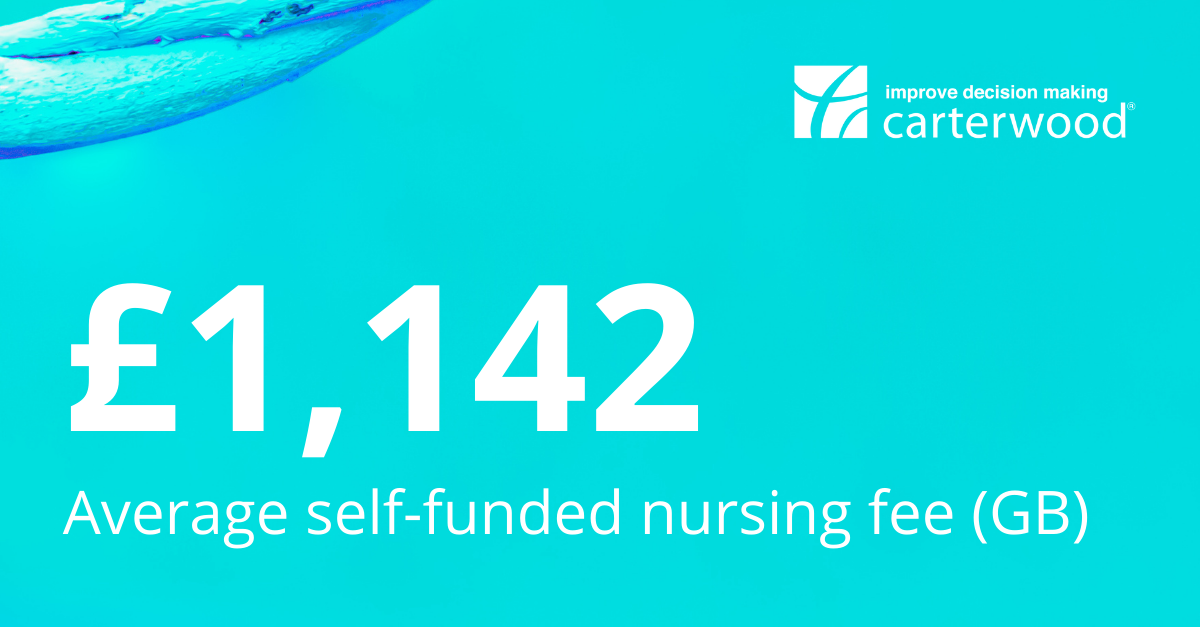
- The average GB nursing self-funded fee rate is £1,142 p/w.
- The average GB personal care self-funded fee rate is £860 p/w.
- Care homes in England with an Outstanding CQC rating have on average 20.6% higher self-funded fee rates compared to homes rated Good. However, there is comparatively little difference between English homes rated across other CQC grades and there is, on balance, no difference in self-funded fee rates between a home rated as Requires Improvement and one that is rated Inadequate.
- Care homes in the South East charge the highest average self-funded nursing care fee rates at £1,339 p/w. All countries and regions, except North East England and Wales, achieve average self-funded fees of over £1,000 p/w for nursing care.
- As expected, across all countries and regions there is a strong correlation between age of home and self-funded fee rates. Homes registered since 2010 charge on average 12.8% and 11.2% more than homes registered between 2000–2009 for nursing and personal care, respectively.
- Overall, 22% and 23% of nursing and personal care self-funded fee rates, respectively, show a premium for dementia care over general elderly frail rates where homes are registered for both care categories.
- Fees for nursing care dementia are on average 1.1% higher than standard older people’s nursing care, and personal care dementia fees are 1.9% higher than those for standard personal care. Where homes have specialist dementia units in larger mixed registration homes and differentiate fee rates, the premiums are significantly higher at 4.5% and 7.6%, for nursing and personal care, respectively.
Fees breakdown by country/region
The table below summarises average self-funded fee rates and house prices by country/region:
| Country/Region | Nursing self-funded ave fee (£) | Personal care self-funded ave fee (£) | Median average house prices (£) |
|---|---|---|---|
| East Midlands | 1,048 | 785 | 205,777 |
| East of England | 1,205 | 943 | 322,870 |
| London | 1,271 | 1,031 | 566,936 |
| North East England | 892 | 733 | 141,472 |
| North West England | 1,055 | 748 | 167,607 |
| Scotland | 1,069 | 924 | 156,995 |
| South East England | 1,339 | 1,006 | 375,051 |
| South West England | 1,196 | 921 | 286,873 |
| Wales | 995 | 745 | 176,219 |
| West Midlands | 1,133 | 815 | 204,027 |
| Yorkshire & The Humber | 1,019 | 733 | 172,901 |
| ALL | 1,142 | 860 | 239,459 |
Table 1 – Average self-funded fee rates and house prices by country/region (Please note: Fee data coverage varies by country/region from 82% to 92%, with an overall average of 89% coverage)
The maps below show the distribution of fee rates by nursing and personal care (including general elderly frail care (OP), and dementia care (DE) categories), respectively across countries/regions.
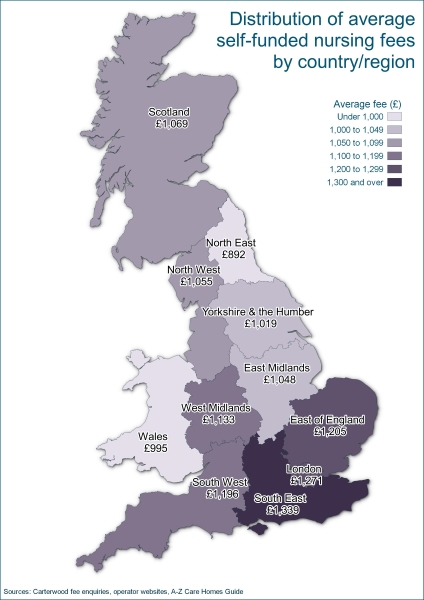
Figure 1 – Distribution of average self-funded nursing fees by country/region
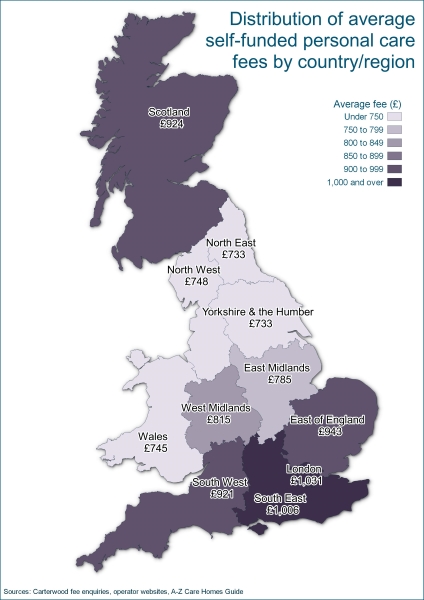
Figure 2 – Distribution of average self-funded personal care fees by country/region
As you would expect, self-funded fee rates are very strongly correlated to average house prices at the country/regional level, with the more affluent areas able to charge the highest fee rates.
However, there are some anomalies:
- London has 39% higher house prices than the South East region, but broadly similar self-funded fee rates. This relationship is driven by a lack of available land to develop new services, with existing stock in London being generally older, coupled with areas of high social deprivation that impact upon the self-funding market but are not reflected in the underlying housing wealth.
- Scotland and the North East have the smallest disparity between average nursing and personal care fees, with a differential of £145 and £158 per week respectively. This differential is significantly smaller than those in the North West, West Midlands, and the South East, where the differential is over £300 per week, and the overall dataset average is £298 per week. We believe it is likely that these smaller disparities are caused by a number of factors, such as differences in asset quality across countries/regions, nursing shortages and recruitment challenges pushing costs of nursing care up in some areas and not others, and differences in funding (specifically affecting Scotland).
- House prices in Scotland are considerably below the GB average, but fee rates – particularly for personal care – remain surprisingly strong compared to other more affluent areas outside of London and the South East. This is driven by the different funding system in Scotland together with a higher proportion of purpose-built homes providing all en-suite and wetroom bedrooms.
Overall average fee rates are, as expected, lower than our preliminary study as this dataset now includes Wales and regions of England with lower underlying wealth profiles, which translates into lower fees and brings the overall average down.
Next up: What’s the relationship between CQC rating and fees for care homes in England?
In our next article, which will be published in the week commencing 12 October 2020, we will explore how self-funded fees vary for nursing and personal care when CQC rating is considered.
If you can’t wait and would like a copy of our full research report in PDF format, please contact Tom Hartley (director) on tom.hartley@carterwood.co.uk or 07715 495062.
Perspectives from the sector
Professor Martin Green, chief executive – Care England
“The social care sector is under more pressure now than ever before and there is an acute need for high-quality data that can help operators adapt to the changes in the market. Carterwood’s comprehensive self-funded fee rate research gives operators clarity when it comes to benchmarking their fees at a time when maximising income has never been more pressing.”
Vic Rayner, executive director – National Care Forum
“Access to good quality data is essential for each and every care home provider as they seek to navigate this turbulent period. As providers struggle to find the time to carry out essential benchmarking activity, Carterwood have once again proved themselves to be a vital partner to the care sector by bringing together important data on care home fees in this important and impactful report.”
Avnish Goyal, chairman – Hallmark Care Homes
“For the first time, it’s fantastic to see a complete overview of fees across the private care home market. Hallmark and Savista are at the forefront of this market and continue to push the boundaries in terms of quality and design. Our continued investment in the provision of outstanding standards of care and developing exceptional environments for later living lifestyles is ultimately underpinned by corresponding fee rates and this research provides confidence that the market is prepared to pay for quality in the right homes, in the right locations.”
Helen Davies-Parsons, CEO Dormy Care Communities
“The research undertaken by Carterwood demonstrates very clearly that the private pay care home market remains buoyant. The long-term negative effects of the COVID-19 pandemic remain largely unknown but what is known is that the need for excellent standards of accommodation coupled with high standards of care will be even more in demand. People are definitely prepared to pay for that quality and this is reassuring to those of us operating in this marketplace”.
Joanne Balmer, CEO – Oakland Care
“At Oakland Care, we are focused towards providing the highest standards of care and service. This latest, comprehensive research from Carterwood demonstrates how vital this is to succeeding in the private pay market. It’s fantastic to see such positive results in terms of fees and this data will be extremely valuable to operators seeking to understand their market position, especially in this current climate.
Access accurate self-funded fee data for 9,000+ elderly care homes with Carterwood Analytics
Carterwood Analytics is now home to the most comprehensive self-funded fee dataset available, with coverage for 94% of the self-funded elderly care home market.
Explore the competition list to view fee information for all homes in your catchment area. Sort homes by minimum and maximum fees for nursing and personal care, and also filter the homes in the catchment to make more meaningful comparisons.
Use our powerful new fee analyser feature to break down self-funded fee rates by first date of registration, CQC rating and ownership of home, as well as by category of care, then benchmark your catchment area against region, Great Britain as a whole, or against the entire portfolio of a specific operator.
Find out more about Carterwood Analytics here, or email sales@carterwoodanalytics.co.uk to book a demo.