We invite you to share our quarterly snapshot of the market as we track the essential market statistics for Great Britain: the Carterwood Index. Here we explore the size of the elderly care home market, analyse the asset quality of operational homes and take a look at the quality and type of care currently. We also delve into the openings and closures over 2021, revisit our self-funded fee research and update you on the predicted shortfall of en-suite and wetroom elderly care home accommodation in England by 2024.
Don’t miss our additional analysis into care home and bed openings and closures throughout 2020 and into 2021, providing an interesting insight into the pace of the market over what has been a most unprecidented 18 months.
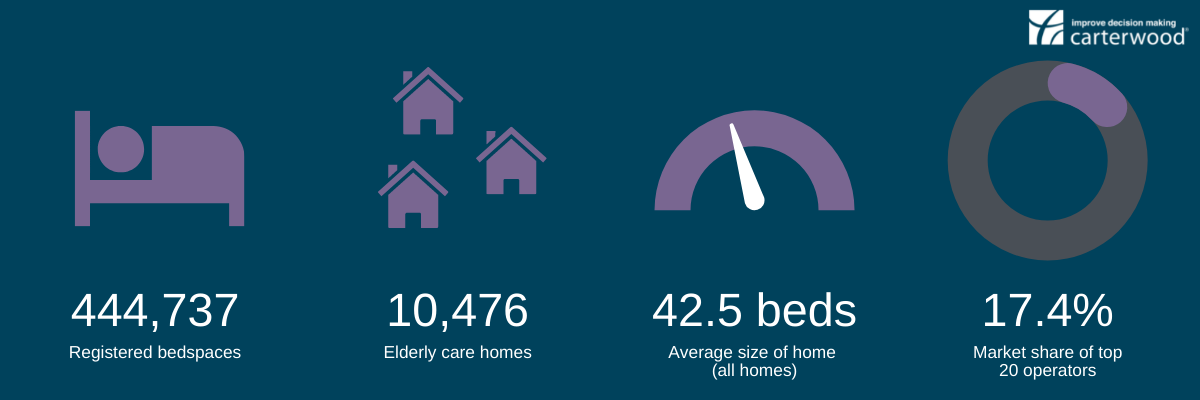
Market size
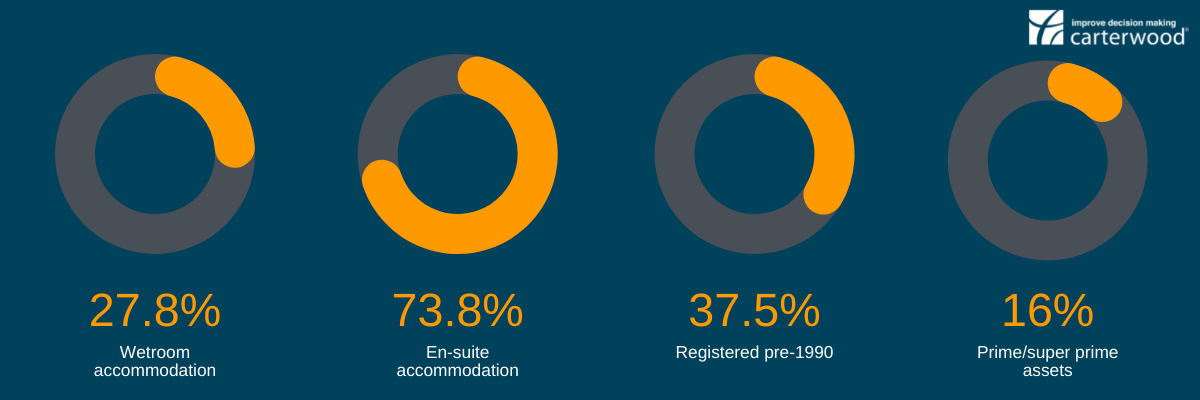
Asset quality
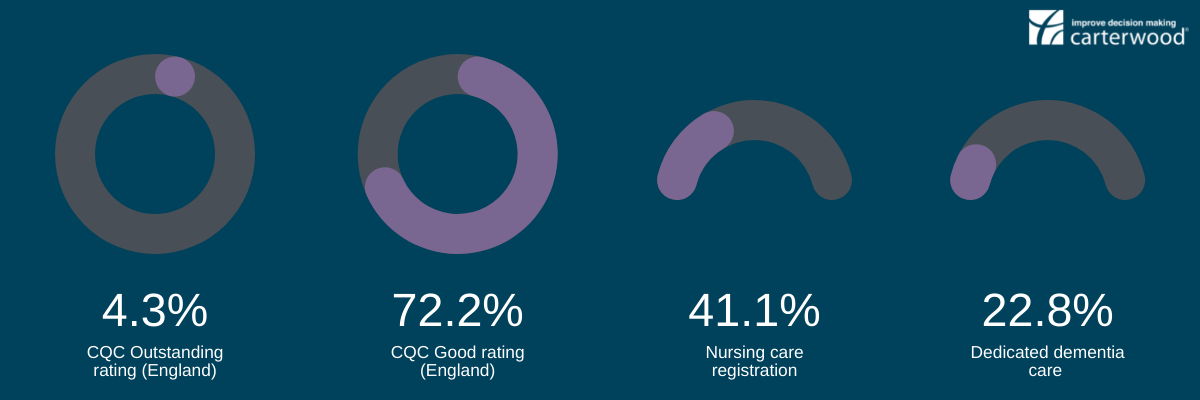
Care
Openings and closures
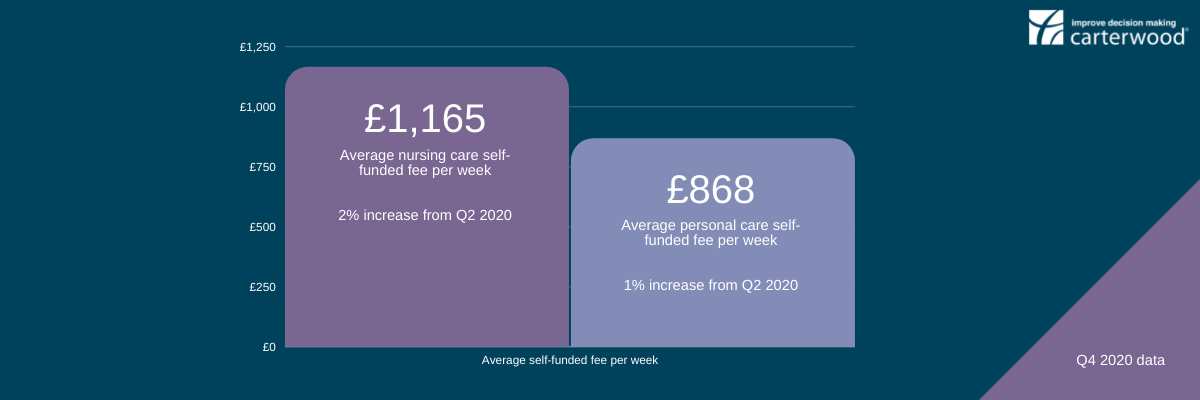
Fees
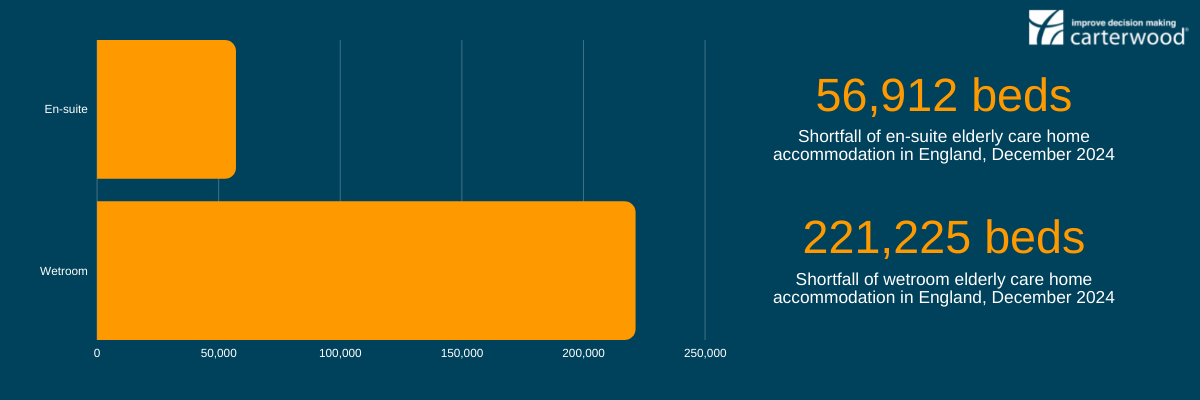
Demand
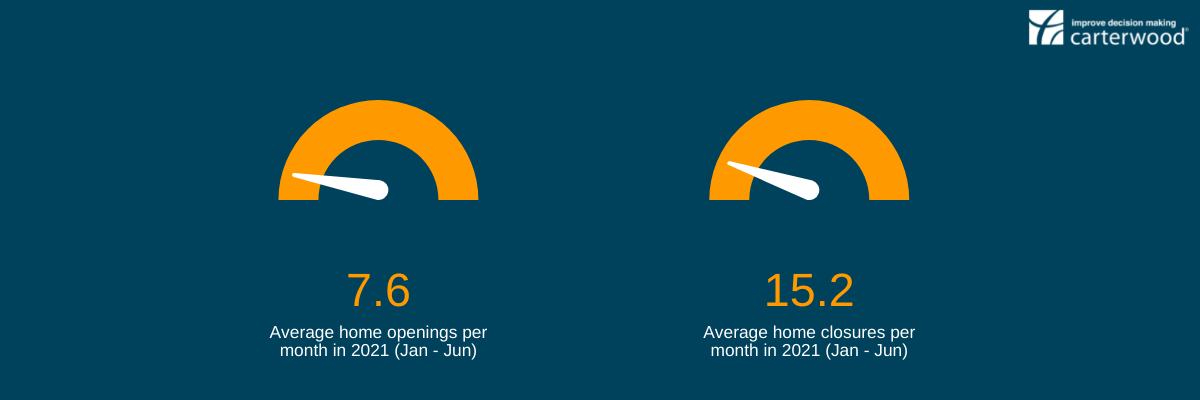
A closer look at openings and closures
Openings
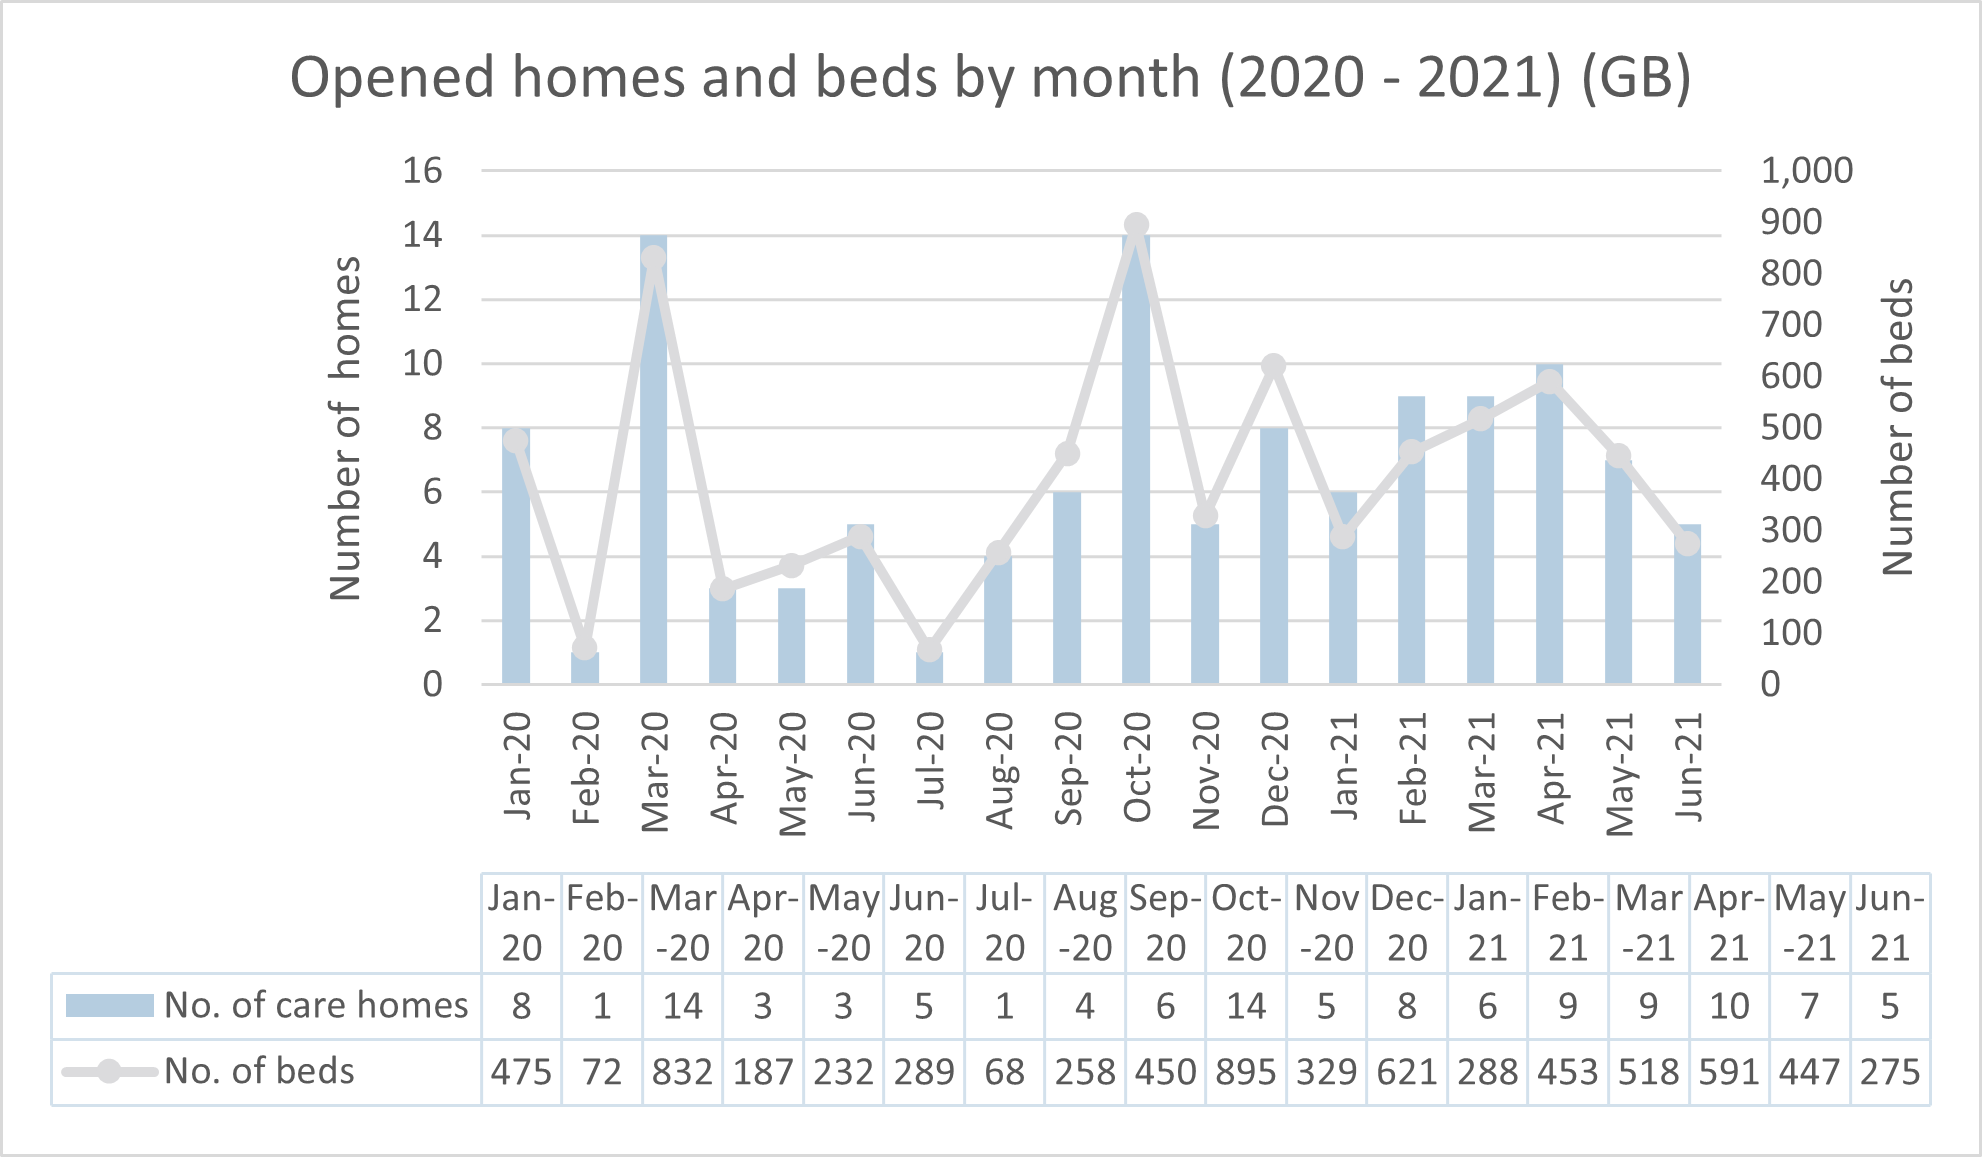
Here we track the number of new care homes and beds brought to the market over the course of 2020 and into the first half of 2021. With the market on the road to post-pandemic recovery, we can reveal an increase in both the average number of home openings and bed openings per month. The period from January to June 2021 has delivered an average of 7.6 homes / 429 beds per month to the market, compared to 6 homes / 392 beds per month in 2020.
However it is worth bearing in mind that these uplifts follow a year like no other, largely due to effects of the pandemic, when the openings of both homes and beds dropped to their lowest for several years.
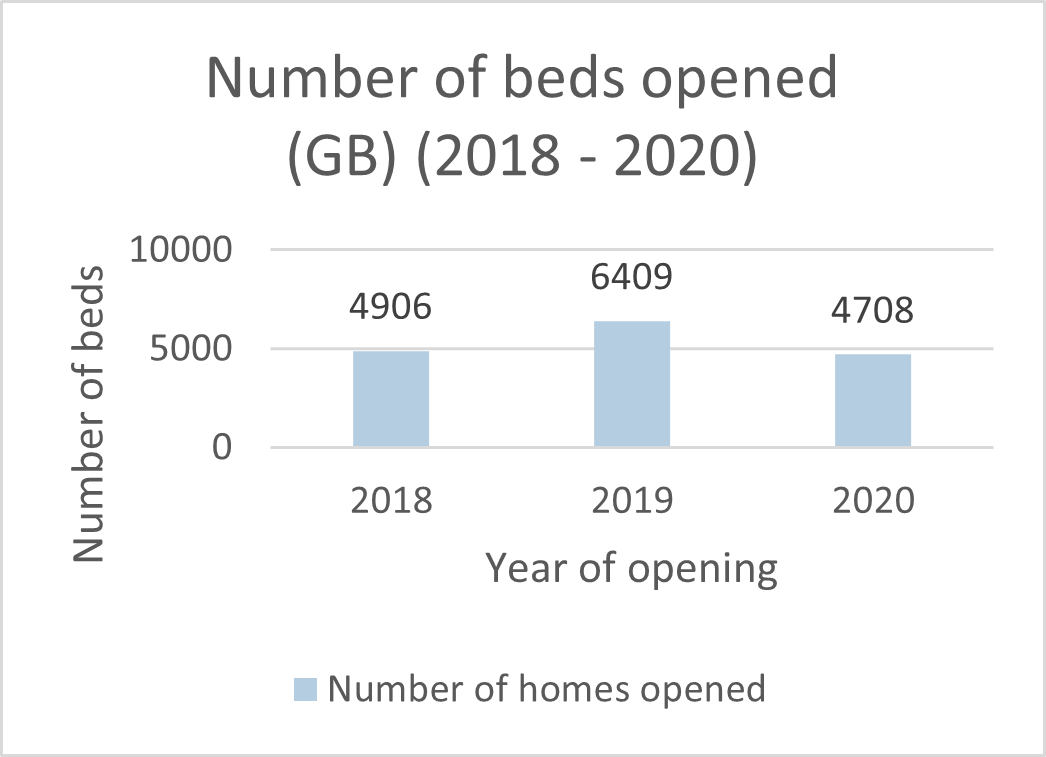
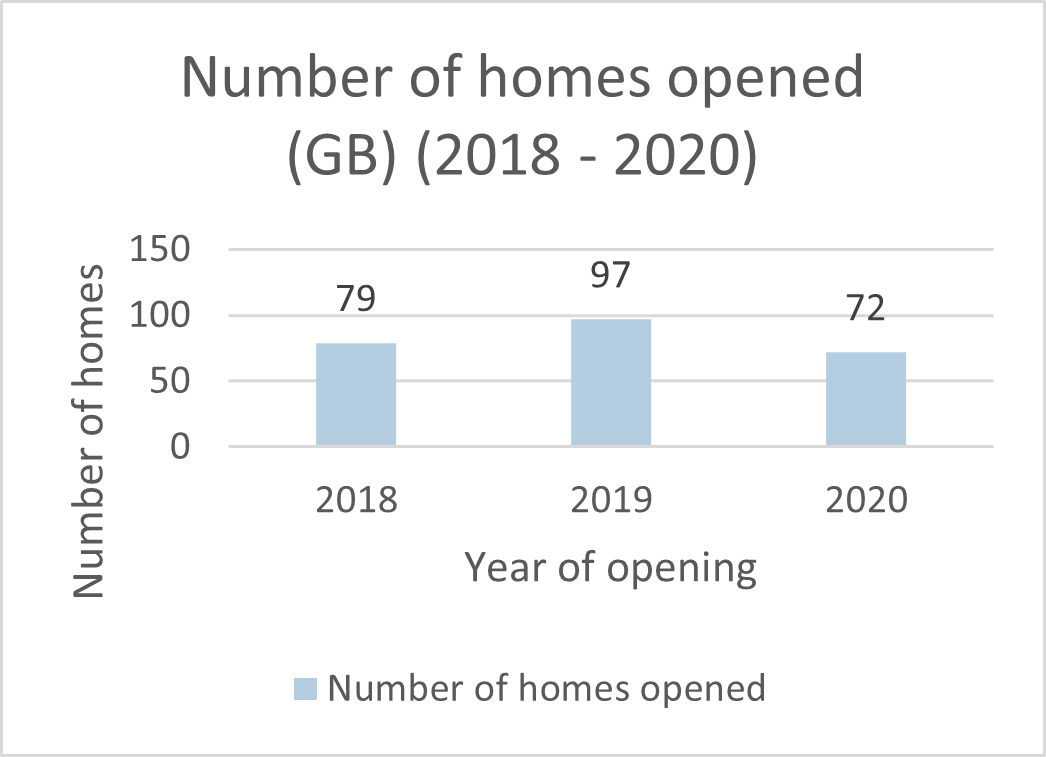
An interesting trend that seems to be developing is the decrease in the average size of new homes. In 2020, new homes opened with an average of 65 beds, a number that has been steady for the past few years. However, the 2021 figures from January to June suggest that new care homes are reducing in size, with the average size of a new care home now being just 57 beds.
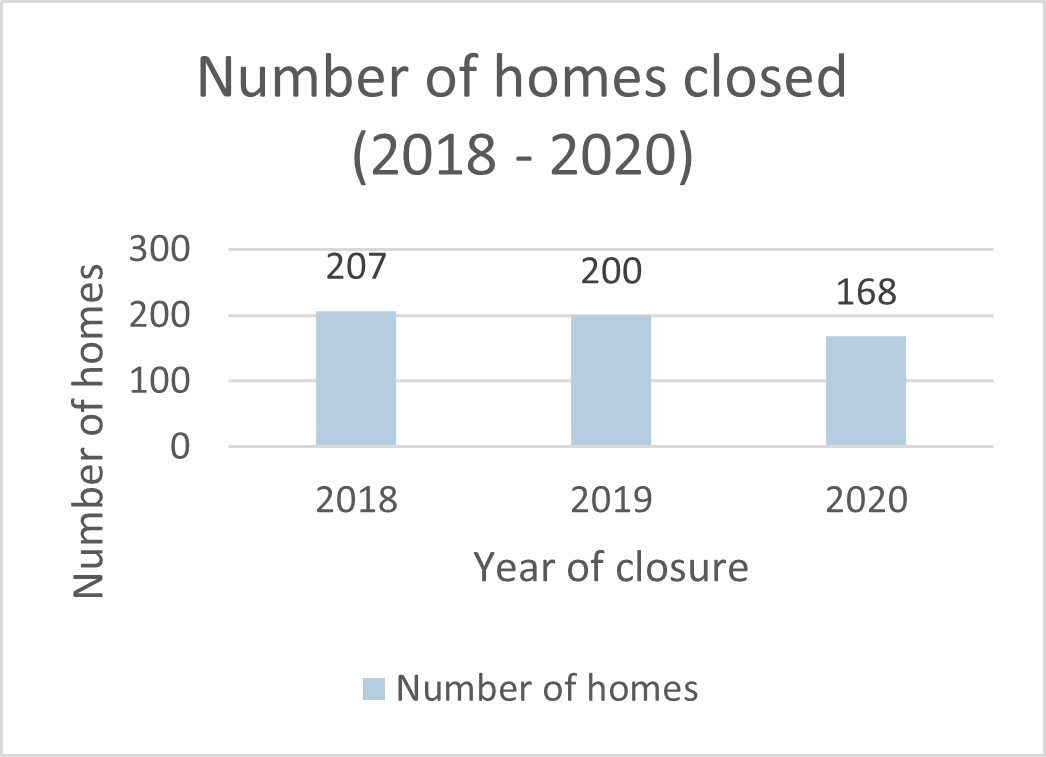
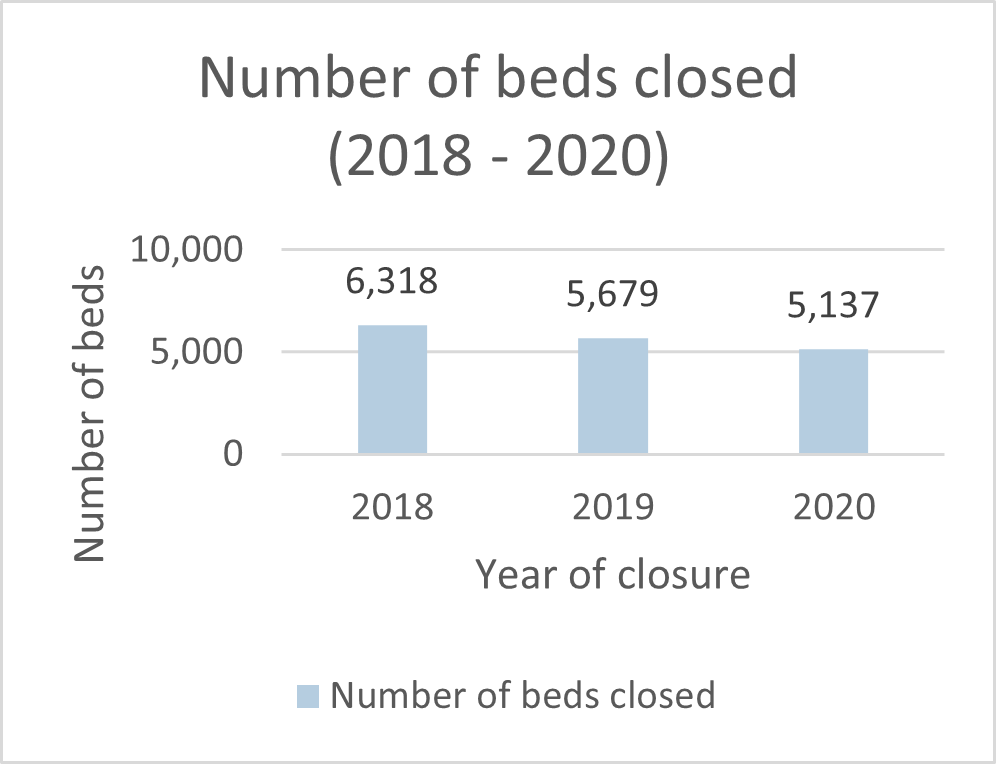
Closures
Our 2021 dataset from January to June reveals a slight increase in the number of home closures, now averaging at 15.2 homes/451 beds per month compared to 14 homes/428 beds per month in 2020.
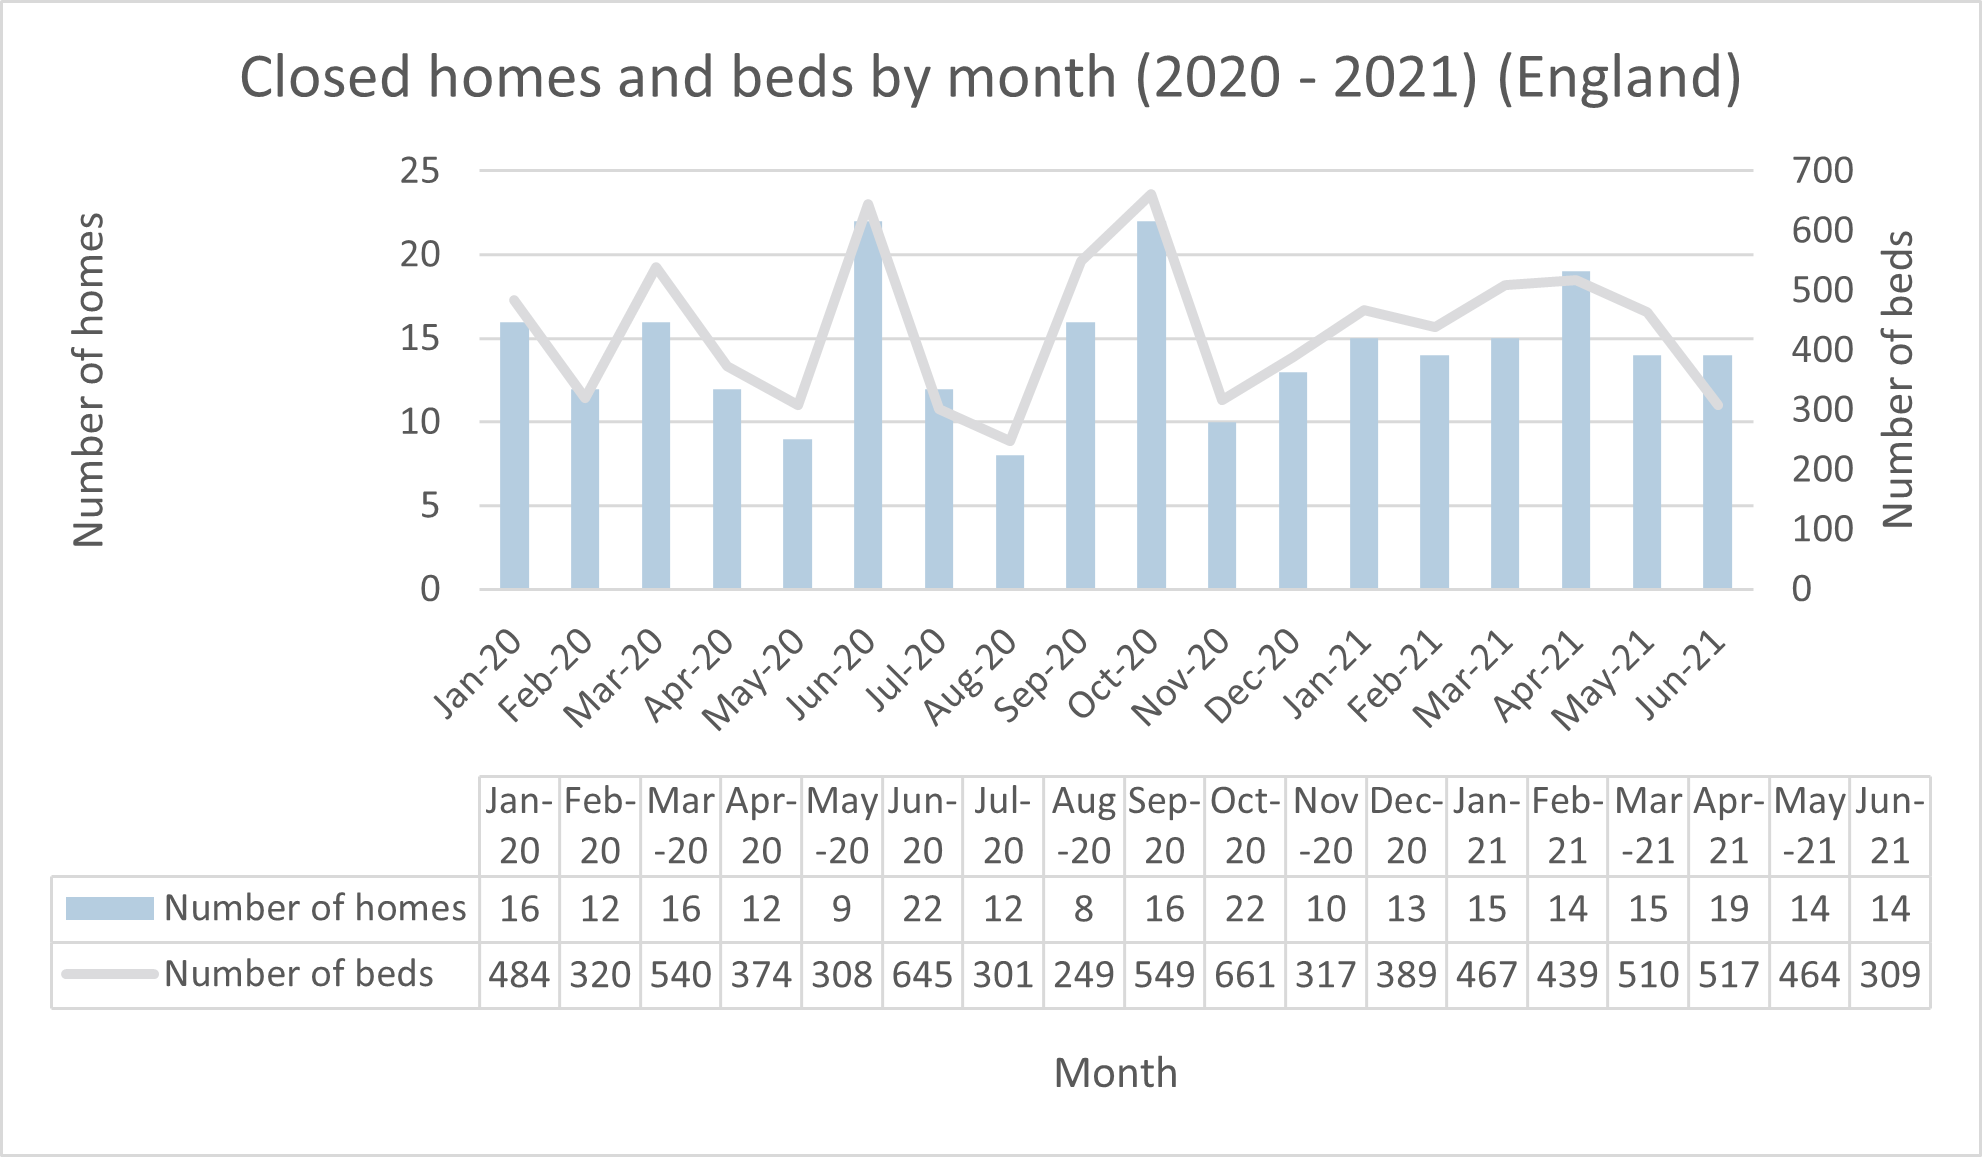
However, when compared with pre-2020 closure figures, the 2021 figures might not be as daunting as they seem. With 2020 featuring the lowest numbers of home and bed closures for several years, the 2021 figures may indicate that closures have returned to the same levels as 2018 and 2019.
Our next quarterly snapshot will reveal more data on how these trends progress and remember to watch this space for our latest fee research, which is due for release this autumn.
Let’s talk
If you are interested in working with an award-winning team to help improve your strategic decision-making, we would be delighted to hear from you.
Our team of sector specialists are here to support your growth plans, providing expert market intelligence, advice and guidance at every step of your journey.
Discover how Carterwood Analytics – our online platform for care home and retirement living market analysis – can help you:
Alternatively, why not get in touch with Tom Hartley on 07715 495062 or tom.hartley@carterwood.co.uk
Notes:
All figures are GB, unless otherwise stated. Updated August 2021.
Sources: Carterwood, LaingBuisson, CQC, Tomorrow’s Guides.
Due to variances in when our sources update their data, there may be a delay in details being updated in our database and some data may have changed since previous publications. Certain details (including registration categories, registration ID and open status) affect whether or not a home would meet the criteria to be included in this data, and may be subject to these variances and delays.