Authors: Ben Hartley, Jessica Stainthorp
This article concludes our series diving deeper into our most recent fee research of over 9300+ elderly care homes in Great Britain. This time, we explore the most comprehensive local authority baseline fee rate data for 2020/2021 available, in order to provide a clear picture of fees across Great Britain’s elderly care home markets.
You can read the previous articles in this series here:
- Self-funded elderly care home fees rise and fall by +5% to -4.8% across Great Britain
- Self-funded fee premium of up to 40% for elderly care homes registered in the last 5 years
- CQC Outstanding homes maintain a high self-funded fee premium
Key takeaways
- There is no clear-cut pattern discernible from local authority level baseline fee rates. In previous reports, we have demonstrated a clear correlation between wealth profile and self-funded fee rates, but this is not the case at the local authority baseline fee rate level.
- The South East region shows huge variation at the baseline minimum level, with some of the highest and lowest minimum baseline rates separating neighbouring authorities with otherwise similar wealth and demographic profiles.
- Cornwall pays some of the highest local authority fee rates, despite, prior to Brexit, the region receiving more economic aid from the EU than almost any other part of the UK (source: Cornwall Community Foundation (CCF) 2019). We consider that supply shortages are driving the high fee rates as there has been little to no development of new care homes in Cornwall, due principally to its remote location from major motorway networks rather than its underlying affluence/deprivation indicators (with some very affluent second-home micro localities inflating underlying house prices). To put this in context, private fee rates in the county rank as mid-table and are on a par with the West Midlands and more affluent areas of the north of England, all of which have seen more care home development. The development of a mid-upper cluster in Cornwall, we consider, would work well, given the lack of differential between the local authority and self-funded rates in the area, with scope for premiums in some of the higher value settlements.
Understanding and overcoming the challenges
We collect the most comprehensive local authority baseline fee rate data available; however, this process isn’t without its challenges. We do this at lower-tier local authority level, but are finding this data increasingly hard to accurately measure and benchmark:
- Some local authorities now refuse to quote any fee range to us, despite a formal freedom of information request, with many local authorities reporting that they agree fee rates on a case-by-case basis subject to need.
- Many local authorities have grading systems, with fee uplifts for better CQC rating, en-suite provision, and other variables.
- The maximum fee rates quoted are now sometimes extraordinarily high, as local authorities often provide the ceiling rate for the very highest level of dependency, even though these rates are paid to a small fraction of the total number of service users supported.
- Local authority boundaries change regularly.
Despite these challenges, we are still able to provide a useful picture of how local authority fees vary around Great Britain. We have summarised the minimum baseline fee rates for nursing (older people) and personal care (older people) in the following maps.
Please note:
- We are showing the minimum rate for ease of reference and not the maximum or ‘average’ (as the data is skewed and an average would be misleading in this case).
- Some fee rates are set at county level (e.g. Surrey) or national level (e.g.Scotland), and where this is the case all lower tier authorities have the same fee rate.
- Greyed out areas indicate that we have received no data or no minimum fee rate has been set.
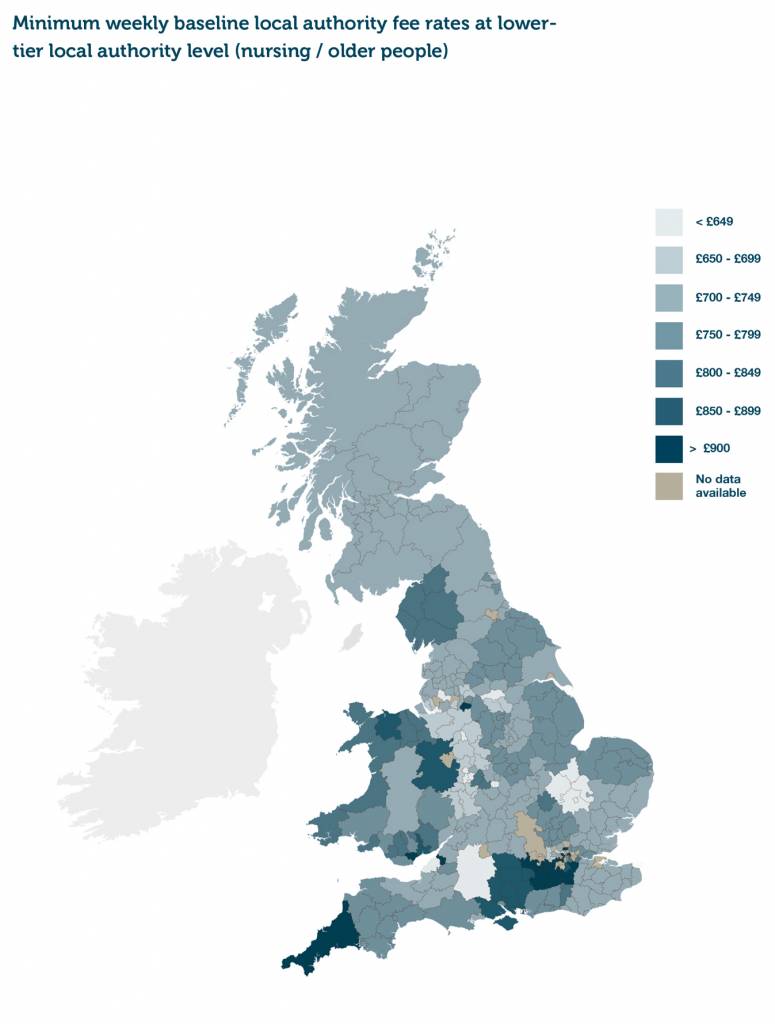
Figure 1 – Minimum baseline local authority fee rates at lower-tier authority level (nursing / older people)
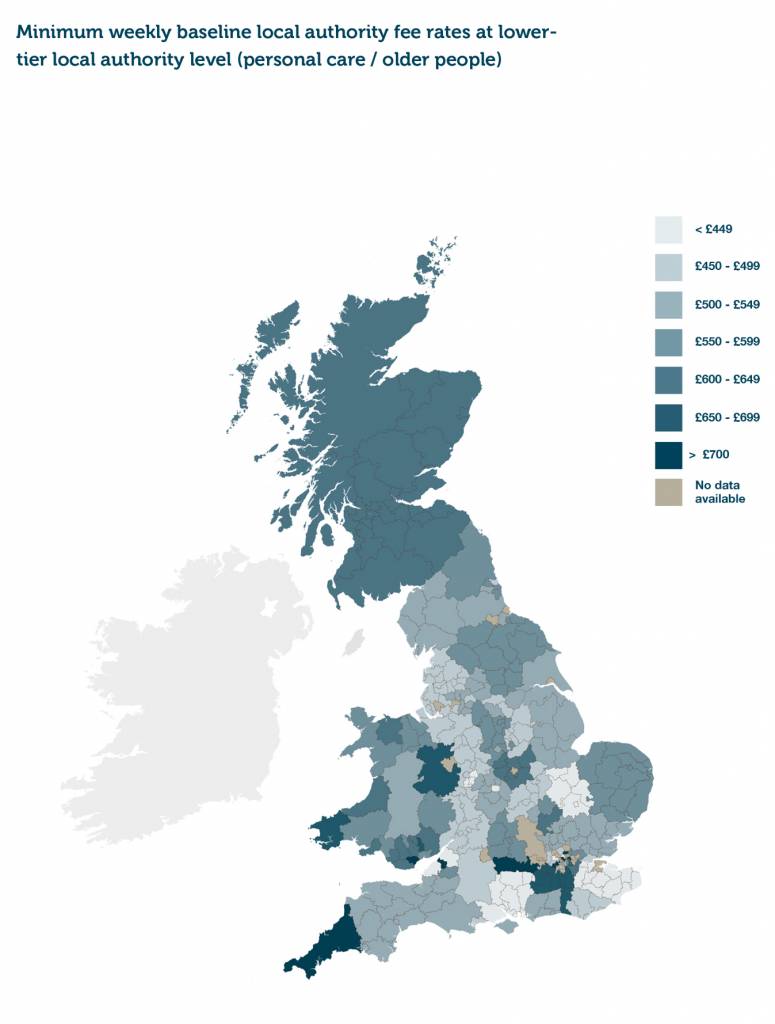
Figure 2 – Minimum baseline local authority fee rates at lower-tier authority level (personal care / older people)
Uncovering untapped markets
To frame the local authority fee rates in some context, we set out below the ten local authorities with the largest en-suite bed requirement shortfalls across Great Britain.
Unsurprisingly, the areas identified are generally located in areas of modest underlying housing wealth, which we would expect with new build activity having been predominantly focused on the South East and more affluent areas of England, Wales and Scotland.
We consider that there is a real opportunity for operators to take advantage of these shortfalls and pinpoint micro-locations of above average wealth, having correlated where local authority fee rates are strong and bed requirements large in order to identify new hotspots for development.
The product would have to be carefully specified and priced to create an economically viable solution; however, we consider that an opportunity clearly exists. In a post-COVID world, areas with high occupancy and large latent demand for beds will be increasingly important when seeking funding and investment approval.
The above also corroborates our long-held view that Cornwall remains a hitherto almost totally untapped market, and first mover advantage will reap dividends when the area is targeted.
| Local authority | Bed requirement in Local Authority area |
|---|---|
| Cornwall | 1,049 |
| Dudley | 923 |
| Liverpool | 864 |
| Bolton | 797 |
| Wakefield | 767 |
| Rhondda Cynon Taf | 756 |
| St. Helens | 691 |
| Northumberland | 679 |
| Trafford | 658 |
| Caerphilly | 639 |
Table 1: Top 10 local authorities with highest en-suite elderly care home bed shortfalls
Please note – basis of assessment:
- En-suite WC and wash hand basin existing supply
- 2021 population base year
- Uses LaingBuisson Age-Standardised Demand (ASD) methodology
- Includes new build planned beds
The robustness of the self-funding market remains central to the long-term viability of the sector, given the consistently disappointing fee rates on offer from all but a handful of local authorities. We believe that, now more than ever, access to accurate self-funded fee data is essential in helping elderly care home operators to benchmark their fees and make their businesses more resilient at this challenging time.
More information
Request our full research report (PDF) to find out:
- How self-funded fees changed across the market in the second half of 2020.
- The difference in self-funded fee rates being quoted by the newest elderly care homes, versus the rest of the market.
- What our data can tell us about the typical profile of a home with an Outstanding CQC rating.
To request a copy of the full report, please email info@carterwood.co.uk or call 01454 838038.
Benchmark your fees against your local competitors in seconds
Carterwood’s comprehensive fee database is accessible at a local market level via our Carterwood Analytics platform. To find out more just email sales@carterwoodanalytics.co.uk