This is the third in a series of four articles that each focus on a different aspect of Carterwood’s updated and significantly expanded research into self-funded fee rates across Great Britain. This week we focus on how fees vary by year of first registration.
You can read the first article, which explored how fees vary by geography, here , and the second, which focused on CQC ratings, here.
If you would like to request a copy of our full research report in PDF format, please contact Tom Hartley (director) on tom.hartley@carterwood.co.uk or 07715 495062.
How does year of first registration affect fees?
We have also analysed fee rates by year of first registration and country/region, using year of first registration as a proxy for asset quality.
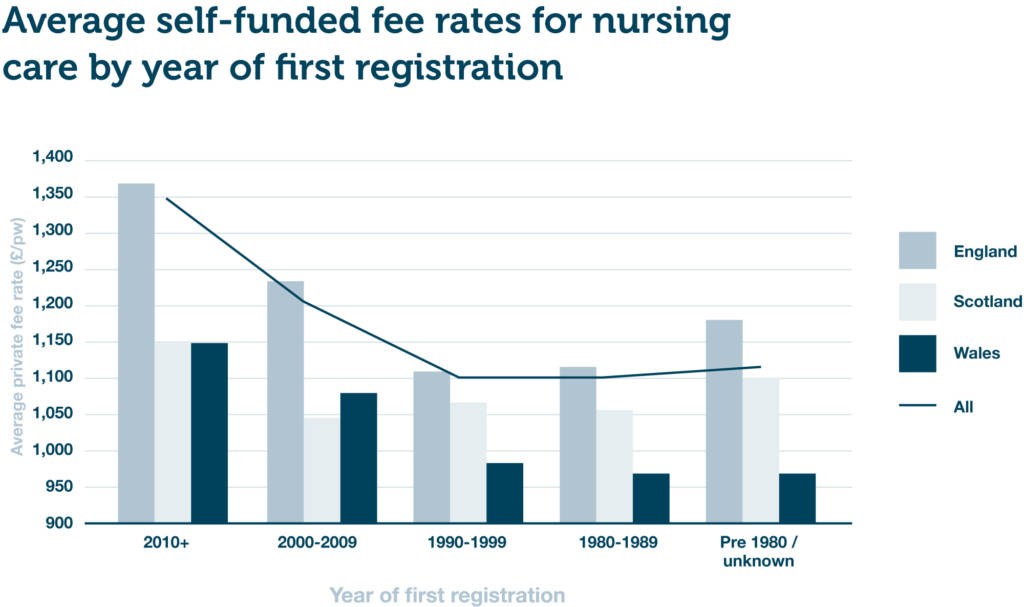
Figure 1 – Mean average self-funded fee rates for nursing care by year of first registration (combined DE/OP)
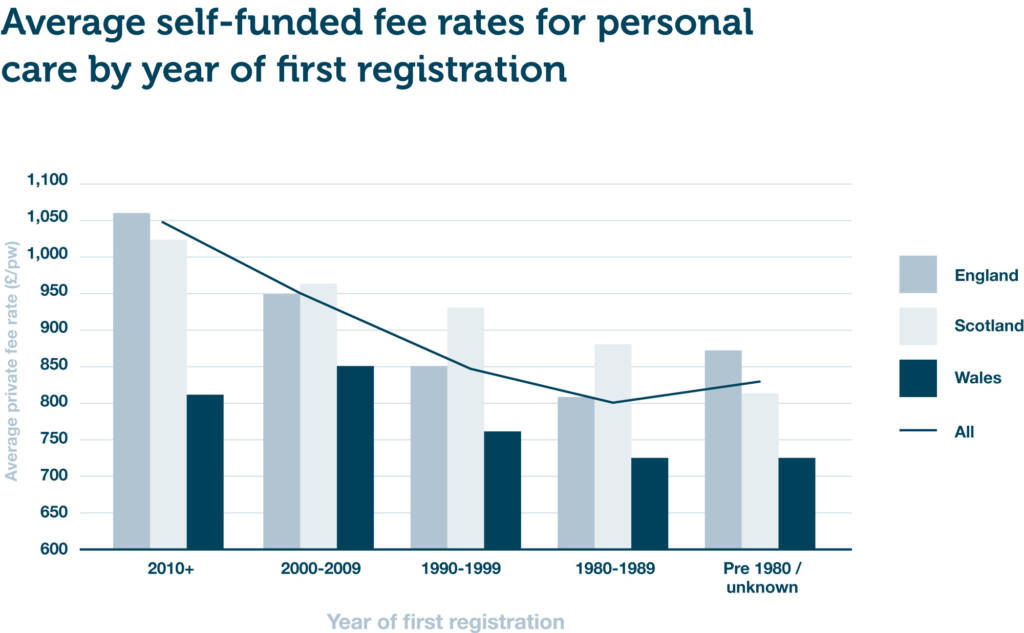
Figure 2 – Mean average self-funded fee rates for personal care by year of first registration (combined DE/OP)
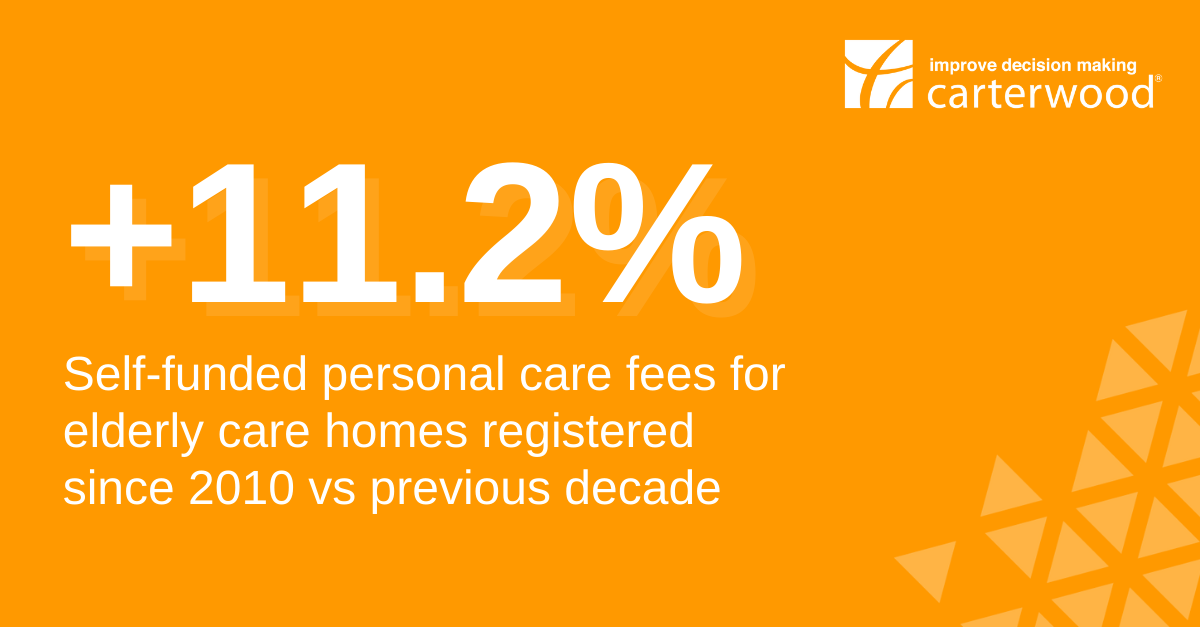
As we would expect, there is a very strong direct correlation between year of first registration and quoted self-funded fee rates. The newer the home, the higher the fee rate. Homes registered since 2010 charge on average 12.8% and 11.2% more than homes registered between 2000-2009 for nursing and personal care respectively.
We can also see that despite shortcomings affecting some of the older stock (including layout challenges and lack of en-suites and wetroom facilities), self-funded fee rates sourced after the onset of COVID-19 remain strong.
At the national level, Wales underperforms at almost every age band compared to Scotland and England, which have broadly similar average self-funded fee rates. These lower average fees in Wales are driven by low average house prices.
When looking at newer care homes, it’s clear that there is a substantial gap (around £200 p/w) between England and Scotland in the nursing fees charged by those registered since 2000. However, when it comes to personal care, the fees charged by homes in those same age bands are almost identical. As we touched on earlier, the differential between nursing and personal care fees in Scotland is much lower than it is in England and Wales. It’s likely that the different funding structures will account for at least a proportion of this differential.
Please note, there are c. 300 homes that were registered between 2016 and 2020 and are not included in this analysis. Our self-funded fee data for these homes was collected prior to 14 May 2020, which was our cut-off to ensure this research reflected a post-outbreak market. Therefore, there may be some variation to the 2010+ data and the overall average in our next publication.
We know from our extensive reporting experience that average fees for homes registered post-2016 exceed the averages stated here for those registered since 2010, given the growth in the high-end self-funded market in the last five years, and demonstrated by many of our clients.
We plan to source updated fee rates for these newer homes during Q4 and incorporate the datapoints into our next fee research release in early 2021.
Next up: Assessing the premium for dementia care in Great Britain
In our final article, which will be published in the week commencing 26 October 2020, we will explore the extent to which elderly care homes are realising a premium in self-funded fees for dementia care.
If you can’t wait and would like a copy of our full research report in PDF format, please contact Tom Hartley (director) on tom.hartley@carterwood.co.uk or 07715 495062.
Background to this research
The COVID-19 pandemic has exacerbated a series of historic challenges facing the adult social care sector and, despite reacting quickly and effectively to minimise the impact from the virus, operators are still burdened by increased costs, below-average occupancy rates, and the long-standing lack of a reformed legislative framework to fix the funding of long-term care.
If our sector is going to be able to adapt to the challenges it faces now and prosper in the future, the robustness of the self-funding market remains central to its long-term viability given the consistently disappointing fee rates on offer from all but a handful of local authorities. We believe that access to accurate self-funded fee data is essential in helping care homes to benchmark their fees and make their businesses more resilient at this challenging time.
Our self-funded fees dataset covers 9,000+ homes, equating to 89% of the elderly care homes in Great Britain that accept self-funded referrals. The breadth and depth of this dataset is unrivalled, and all fee rates have been collected since May 2020. This enables us to demonstrate the self-funded fee dynamics at play across Great Britain with remarkable clarity.
To discuss our research in more detail, or to find out more about getting access to our comprehensive fee data via Carterwood Analytics, contact Tom Hartley (director) on tom.hartley@carterwood.co.uk or 07715 495062.
Overall key findings
- The average GB nursing self-funded fee rate is £1,142 p/w.
- The average GB personal care self-funded fee rate is £860 p/w.
- Care homes in England with an Outstanding CQC rating have on average 20.6% higher self-funded fee rates compared to homes rated Good. However, there is comparatively little difference between English homes rated across other CQC grades and there is, on balance, no difference in self-funded fee rates between a home rated as Requires Improvement and one that is rated Inadequate.
- Care homes in the South East charge the highest average self-funded nursing care fee rates at £1,339 p/w. All countries and regions, except North East England and Wales, achieve average self-funded fees of over £1,000 p/w for nursing care.
- As expected, across all countries and regions there is a strong correlation between age of home and self-funded fee rates. Homes registered since 2010 charge on average 12.8% and 11.2% more than homes registered between 2000–2009 for nursing and personal care, respectively.
- Overall, 22% and 23% of nursing and personal care self-funded fee rates, respectively, show a premium for dementia care over general elderly frail rates where homes are registered for both care categories.
- Fees for nursing care dementia are on average 1.1% higher than standard older people’s nursing care, and personal care dementia fees are 1.9% higher than those for standard personal care. Where homes have specialist dementia units in larger mixed registration homes and differentiate fee rates, the premiums are significantly higher at 4.5% and 7.6%, for nursing and personal care, respectively.
The need for quality data
Professor Martin Green, chief executive – Care England
“The social care sector is under more pressure now than ever before and there is an acute need for high-quality data that can help operators adapt to the changes in the market. Carterwood’s comprehensive self-funded fee rate research gives operators clarity when it comes to benchmarking their fees at a time when maximising income has never been more pressing.”
Vic Rayner, executive director – National Care Forum
“Access to good quality data is essential for each and every care home provider as they seek to navigate this turbulent period. As providers struggle to find the time to carry out essential benchmarking activity, Carterwood have once again proved themselves to be a vital partner to the care sector by bringing together important data on care home fees in this important and impactful report.”
Access accurate self-funded fee data for 9,000+ elderly care homes with Carterwood Analytics
Carterwood Analytics is now home to the most comprehensive self-funded fee dataset available, with coverage of 94% of the self-funded elderly care home market.
- Explore the competition list to view fee information for all homes in your catchment area. Sort homes by minimum and maximum fees for nursing and personal care, and filter the homes in the catchment to make more meaningful comparisons.
- Use our powerful new fee analyser feature to break down self-funded fee rates by date of first registration, CQC rating and ownership of home, as well as by category of care, then benchmark your catchment area against region, Great Britain as a whole, or against the entire portfolio of a specific operator.
Find out more about Carterwood Analytics here, or email sales@carterwoodanalytics.co.uk to book a demo.