Pricing a retirement living scheme can be tricky. Unlike a general needs housing development, where there is likely to be lots of local evidence of sold prices achieved by similar types of properties, the low volume of genuinely comparable retirement living schemes around the country makes it difficult to make meaningful local comparisons.
However, that doesn’t mean it’s impossible to calculate achievable prices for such schemes, it just requires consideration from a few different angles.
Determining your catchment area
The first step towards calculating achievable sales rates is to determine the realistic catchment for your scheme. By this, we specifically mean the geographical area your scheme will attract residents from.
A small urban scheme will typically attract interest from a very localised market, while a larger village scheme will do so from a much broader market. We typically recommend a 2- to 5-mile catchment for a smaller, town-centre development, with a 10 to 15+-mile radius for a larger, edge of town retirement village scheme.
There are a variety of other factors that can influence catchment size, such as scheme specification, target market, and whether the catchment is urban or rural in nature.
With this is mind, it may be necessary to conduct pricing analysis across a number of different catchment sizes to consider different scenarios.
Another critical component in the decision-making process is the proposed market tier for the development. Here’s how we’d define the different tiers of retirement living schemes when we are looking at catchment demographic wealth profile to indicate numbers of households that can potentially afford property prices in the area.
- Middle tier: Middle market product targeting households moving from semi-detached, terraced and apartment properties. Average 1-bed size: 500-600 sq.ft. Average 2-bed size: 700-850 sq.ft
- Middle-upper: Targeting movers from a wide market across all housing types. Average 1-bed size: 601-750 sq.ft. Average 2-bed size: 751-1000 sq.ft
- Top-end: Scheme will target homeowners in the top of the market, focusing on households in detached and semi-detached properties. Average 1-bed size: 751+ sq.ft. Average 2-bed size: 1001+ sq.ft
For example, a middle tier scheme in the suburbs of Oxford would likely only attract local residents from the city itself, so a three-mile catchment would be appropriate to work from (see below):
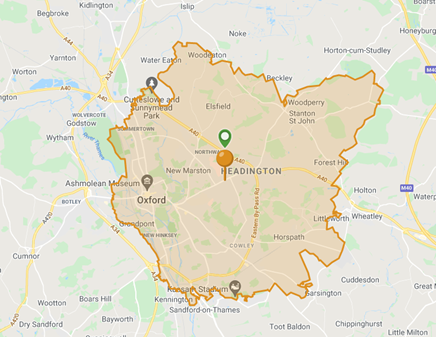
Figure 1: 3-mile catchment around Headington, Oxford (Source: Carterwood Analytics | Retirement Living)
Whereas a top-end scheme might pull from up to 15+ miles around the city, attracting residents from a far greater population. Indeed, some top-end retirement villages can attract a small proportion of residents from many miles away.
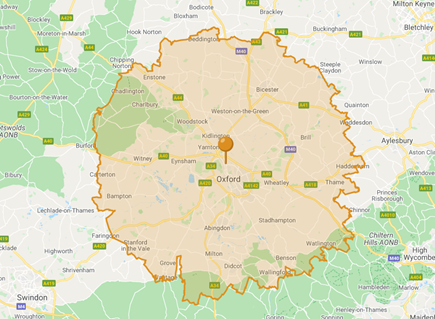
Figure 2: 15-mile catchment around Summertown, Oxford (Source: Carterwood Analytics | Retirement Living)
Making meaningful comparisons
Once you’ve determined the realistic catchment area that your scheme can attract residents from, it’s time to assess local market comparables to establish the sales prices that might be achievable.
There are three traditional ways of assessing comparable sales evidence :
- Using general needs housing residential sales data
- Using local retirement living comparable schemes
- Using comparable evidence from areas with similar demographic profiles
1. Using general needs housing residential sales data
Retirement living is a subset of the gen eral needs housing market and as such, pricing assessments are inevitably informed by it.
What‘s more, because the vast majority of private retirement living transactions are funded from the equity released through the sale of an existing home, the value of existing housing stock has a direct link to the price most retirement living purchasers can pay.
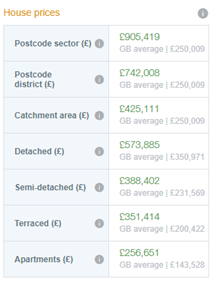
The first step then, is to evaluate the average house prices by property type within your catchment area. This data is available from the Land Registry / Registers of Scotland, and enables you to zero in on the target market for your scheme. For example, a top-end scheme will target households living in detached or semi-detached properties, so the average house prices for those property types are of most relevance. For a middle market scheme, the average house prices for semi-detached, terraced, and apartment properties will be most informative.
Once you have a picture of the average house prices for your target market, it’s also important to make sure there is a sufficient number of those households in your catchment area. It’s all well and good having a top-end scheme and there being average detached house prices of £600k+, but if there are only a handful of such households in your catchment, you’re unlikely to sell many units. A good rule of thumb is to ensure that your scheme’s total number of units is less than 5% of the number of qualifying households at your chosen price point.
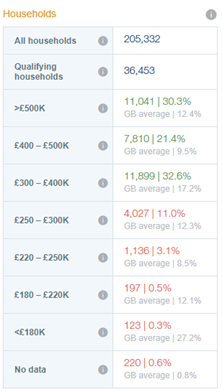
Using census data, it’s possible to identify exactly how many households there are in the catchment area that meet the following criteria:
- Home is owned outright
- Household reference person (HRP) is 65+ years of age
The first of these criteria is important to ensure that the homeowner has 100% equity in their property, the latter because the 65+ demographic is most likely to move into a retirement scheme.
You can then overlay that data with the average house prices to find out how many homes are owned outright, with an HRP that’s 65+, and the average property value is £500k+, for example.
This analysis shows the depth of the market at different price ranges.
2. Using local retirement living comparable schemes
Understanding the housing wealth of qualifying households – as detailed above – is an important part of understanding pricing potential. However, it’s also important to investigate any available sales evidence from existing local retirement living schemes, as a more direct comparison.
Retirement living schemes often achieve “premiums” over and above a similar comparable development to reflect the provision of on-site care / amenities and additional features required for specialist schemes targeting older people. Local evidence of premiums above local residential ensures that the scheme does not undersell itself when seeking to cater to its niche market.
This data – again available from Land Registry – can provide an insight into the sales prices achieved by schemes of a similar type to yours.
3. Using comparable evidence from areas with similar demographic profiles
A common issue with this approach is the paucity of comparable schemes within the majority of locations across Great Britain. In situations where this is the case, the next best approach is to look at comparable schemes in locations that are further afield, but have similar characteristics (e.g. demographics, house prices, size) to your location.
Widening your data pool
It’s important to note that the comparable sales price approaches above reference Land Registry sold data. To bolster this evidence and gain a more comprehensive view of achievable prices, we recommend supplementing this dataset with current asking price data from property marketing portals and enquiries with local estate agents.
Detailed intelligence relating to new developments in progress or recently completed are often of more value than average rates of older, poorer qualty stock. Identifying and examining in detail these “key” comparables is an essential part of the pricing process.
Factoring in ‘affordability’
In the section above we explored how to can gauge sales pricing for a retirement living scheme by using comparable residential sales data for different property types in your catchment area.
This approach provides the essential information required to assess achievable sales prices, but it can be refined further by incorporating affordability measures, which account for scheme-specific or local market factors that will affect pricing.
A typical affordability methodology, and the one used by Carterwood’s advisory team, is to multiply each property type by an appropriate weighting that depicts the residual amount we anticipate a typical purchaser would expect to retain from the sale of their existing property when purchasing retirement living property – this being greater for a detached dependent property than for a terraced dependent property, for example – then creating a weighted average of these figures.
Scheme premiums and downsizing discount levels can be highly variable and can vary geographically, by housing type / market tier and by operator. Thorough sensivity analyis is therefore actively encouraged to ensure a full picture of the market is achieved.
The resultant affordability measure would then also be compared with local OPH comparables, and in the case of a proposed site with limited such evidence, wider comparable schemes in similar value locations, to move towards a more accurate and nuanced valuation.
Analysis is futher refined by assessing the resultant “affordable” capital pricing levels against the number of target households in the different catchment areas. The developer can then get a sense of the level of market penetration required for each scheme and how far the scheme will need to reach. If the level of penetration looks too high for the market tier and likely catchment area, then target prices need to be lowered or changes to the scheme design / unit sizes to make units more affordable in the local area.
Summary
Is pricing a retirement living scheme art, or science? The reality is that it’s a bit of both.
Without current, accurate data it’s extremely difficult to get even close to the right answer, but the raw numbers will only get you so far. Without significant experience and deep insight into the nuances of how schemes affect local markets, it’s impossible to calibrate pricing to its maximum possible rate.
At Carterwood we provide the data in the form of our Carterwood Analytics | Retirement Living platform, which puts sales data for private retirement living schemes across Great Britain at the fingertips of developers, operators, and investors. If you need a second opinion to back up your own insights, we also have an experienced, sector-specialist advisory team on hand to assist you with market-leading due-diligence and planning reports.
To find out more, visit Carterwood Analytics | Retirement Living
Author: Sam Sefton