This is the second in a series of four articles that each focus on a different aspect of Carterwood’s updated and significantly expanded research into self-funded fee rates across Great Britain. This week we focus on how fees vary by CQC rating.
You can read the first article, which explored how fees vary by geography, here.
If you would like to request a copy of our full research report in PDF format, please contact Tom Hartley (director) on tom.hartley@carterwood.co.uk or 07715 495062.
What’s the relationship between CQC rating and fees for care homes in England?
We have assessed average self-funded fee rates by country/region and by CQC rating to determine if there is a relationship between operational quality and fee rate performance. This analysis does not claim causality, but simply reveals the correlation between CQC rating and fee rates charged. We have restricted this analysis to England, due to the difference in inspection grading systems in Scotland and Wales.
Before we get begin, it’s important to note that CQC ratings are not a commercial metric, but a reflection of the quality of care provided to residents and the supportiveness of the working environment for staff. The framing of this research is commercial, but we are keen not to lose sight of the wider context within which it sits.

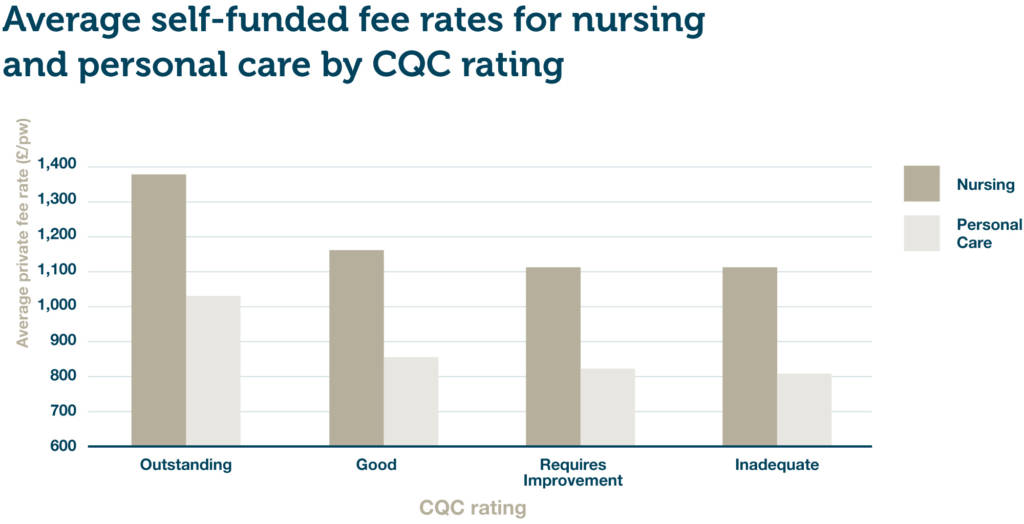
Figure 1 – Mean average fee rates for nursing and personal care by CQC rating (combined DE/OP)
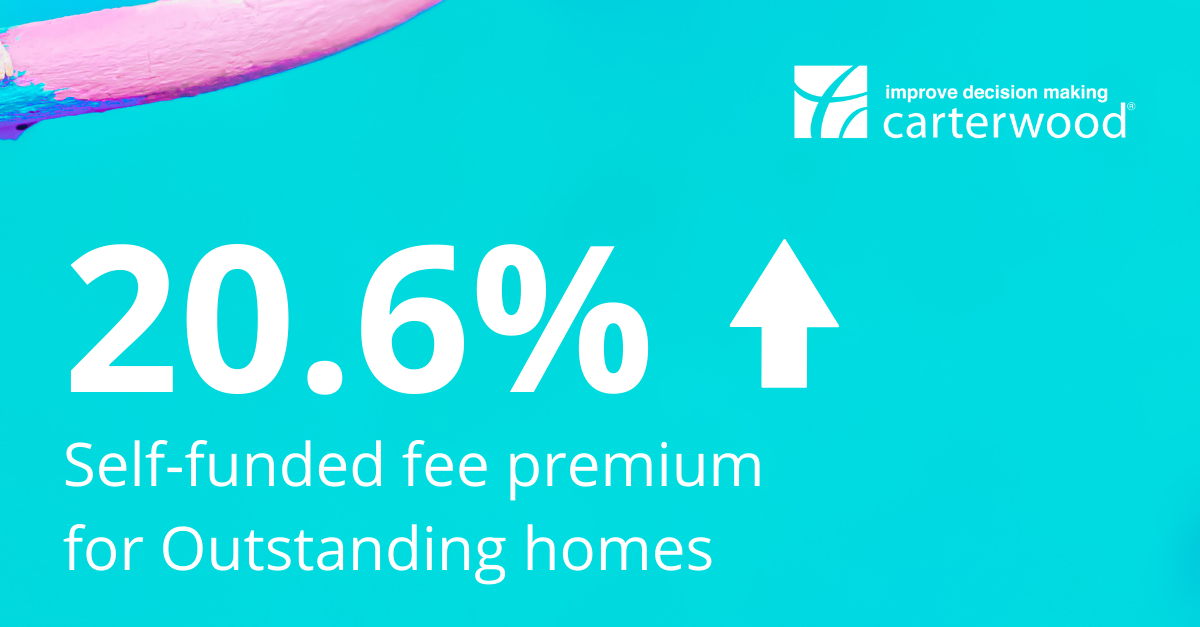
Outstanding care homes charge a 20.6% premium
In our preliminary study, we found that there was a very strong positive impact on fee rates for Outstanding homes; depending on the region, these homes quoted fee rates between 11.9% and 24.4% higher than homes rated Good, with the total dataset showing a 13.4% average premium in fee rates for Outstanding vs Good homes.
Now that we have included homes below 30 beds in size and expanded the dataset to include all regions of England and Wales, it’s interesting to see that the relationship between Outstanding rating and self-funded fee premium has become significantly more pronounced.
We can now confirm that the overall average premium in fee rates across both nursing and personal care stock between a home rated Outstanding and Good is 20.6%.
Our unique dataset provides a complete cross section of asset types, from top-end new purpose-built facilities to older style former local authority stock with no en-suites. While we are conscious that we are only demonstrating correlation and not causality, this data offers robust evidence of an ability to charge a significant premium for an Outstanding home, which may benefit operators when setting pricing.
3% average fee differential between Good and Requires Improvement
Our previous finding that there is a smaller differential in the average fee rates being charged by homes rated Good vs Requires Improvement remains consistent in this more comprehensive dataset.
Homes with a Good rating across England do charge a premium above those with Requires Improvement or Inadequate, but, at 3%, it is considerably smaller than between Outstanding and Good.
We have been surprised by this smaller differential between homes rated Good and Requires Improvement. We know that operators work incredibly hard to achieve and maintain a Good rating, and we would expect that to yield a more sizeable uplift in self-funded fee rates. However, as noted earlier in this section, it’s clear that the most important effect of a Good rating is not a commercial one, but rather the high quality of care residents receive at that home, and the acknowledgement of the tireless work that has gone into achieving that rating.
Interestingly, across all homes in England the differential between self-funded fee rates at homes rated Requires Improvement and Inadequate is still effectively zero. This reveals an interesting insight about the charging policy of homes when they are struggling with CQC compliance and regulatory issues – namely that it does not appear to affect the way these homes charge for their services.
Overall, commercially the message is clear – people will pay a premium for quality but there is less scope for significant material uplifts unless you are rated Outstanding.
Next up: What’s the relationship between self-funded fees and age of elderly care homes across Great Britain?
In our next article, which will be published in the week commencing 19 October 2020, we will explore how self-funded fees vary when year of first registration is taken into account.
If you can’t wait and would like a copy of our full research report in PDF format, please contact Tom Hartley (director) on tom.hartley@carterwood.co.uk or 07715 495062.

Background to this research
The COVID-19 pandemic has exacerbated a series of historic challenges facing the adult social care sector and, despite reacting quickly and effectively to minimise the impact from the virus, operators are still burdened by increased costs, below-average occupancy rates, and the long-standing lack of a reformed legislative framework to fix the funding of long-term care.
If our sector is going to be able to adapt to the challenges it faces now and prosper in the future, the robustness of the self-funding market remains central to its long-term viability given the consistently disappointing fee rates on offer from all but a handful of local authorities. We believe that access to accurate self-funded fee data is essential in helping care homes to benchmark their fees and make their businesses more resilient at this challenging time.
Our self-funded fees dataset covers 9,000+ homes, equating to 89% of the elderly care homes in Great Britain that accept self-funded referrals. The breadth and depth of this dataset is unrivalled, and all fee rates have been collected since May 2020. This enables us to demonstrate the self-funded fee dynamics at play across Great Britain with remarkable clarity.
To discuss our research in more detail, or to find out more about getting access to our comprehensive fee data via Carterwood Analytics, contact Tom Hartley (director) on tom.hartley@carterwood.co.uk or 07715 495062.
Overall key findings
- The average GB nursing self-funded fee rate is £1,142 p/w.
- The average GB personal care self-funded fee rate is £860 p/w.
- Care homes in England with an Outstanding CQC rating have on average 20.6% higher self-funded fee rates compared to homes rated Good. However, there is comparatively little difference between English homes rated across other CQC grades and there is, on balance, no difference in self-funded fee rates between a home rated as Requires Improvement and one that is rated Inadequate.
- Care homes in the South East charge the highest average self-funded nursing care fee rates at £1,339 p/w. All countries and regions, except North East England and Wales, achieve average self-funded fees of over £1,000 p/w for nursing care.
- As expected, across all countries and regions there is a strong correlation between age of home and self-funded fee rates. Homes registered since 2010 charge on average 12.8% and 11.2% more than homes registered between 2000–2009 for nursing and personal care, respectively.
- Overall, 22% and 23% of nursing and personal care self-funded fee rates, respectively, show a premium for dementia care over general elderly frail rates where homes are registered for both care categories.
- Fees for nursing care dementia are on average 1.1% higher than standard older people’s nursing care, and personal care dementia fees are 1.9% higher than those for standard personal care. Where homes have specialist dementia units in larger mixed registration homes and differentiate fee rates, the premiums are significantly higher at 4.5% and 7.6%, for nursing and personal care, respectively.
The need for quality data
Professor Martin Green, chief executive – Care England
“The social care sector is under more pressure now than ever before and there is an acute need for high-quality data that can help operators adapt to the changes in the market. Carterwood’s comprehensive self-funded fee rate research gives operators clarity when it comes to benchmarking their fees at a time when maximising income has never been more pressing.”
Vic Rayner, executive director – National Care Forum
“Access to good quality data is essential for each and every care home provider as they seek to navigate this turbulent period. As providers struggle to find the time to carry out essential benchmarking activity, Carterwood have once again proved themselves to be a vital partner to the care sector by bringing together important data on care home fees in this important and impactful report.”
Access accurate self-funded fee data for 9,000+ elderly care homes with Carterwood Analytics
Carterwood Analytics is now home to the most comprehensive self-funded fee dataset available, with coverage of 94% of the self-funded elderly care home market.
- Explore the competition list to view fee information for all homes in your catchment area. Sort homes by minimum and maximum fees for nursing and personal care, and filter the homes in the catchment to make more meaningful comparisons.
- Use our powerful new fee analyser feature to break down self-funded fee rates by date of first registration, CQC rating and ownership of home, as well as by category of care, then benchmark your catchment area against region, Great Britain as a whole, or against the entire portfolio of a specific operator.
Find out more about Carterwood Analytics here, or email sales@carterwoodanalytics.co.uk to book a demo.


