Authors: Ben Hartley, Jessica Stainthorp
Background
Over the last eighteen months, Carterwood has undertaken a comprehensive fee research exercise across the elderly care home sector in Great Britain. In Q2 2020 we collected self-funded quoted fee rates for over 9,000 homes, enabling us to shine a light on how fee rates change up and down Great Britain, as well as how the characteristics of homes correlate with the fees they quote.
We updated this dataset during Q4 2020 and have done so again in Q2 2021. This latest dataset presents the opportunity to examine how self-funded fees have changed year-on-year, across an unprecedented sample size and at a time of unbelievable upheaval across the sector.
The COVID-19 pandemic is still a defining factor of our everyday lives and our organisational decision-making. That said, the vaccine rollout has been a tremendous success and mortality rates in elderly care homes have been stable around the five-year average for several months.
These improved circumstances have led to increased referrals and a partial recovery in occupancy rates back towards pre-pandemic levels, even if we are still some months away from full recovery.
Despite this rosier picture, there remain significant structural pressures on the sector. Staffing shortages are severe, and costs involved in delivering care have irreversibly increased due to the requirement for more stringent infection control procedures than existed pre-pandemic.
Against this backdrop, the robustness of the self-funding market remains central to the long-term viability of the sector, given the consistently disappointing fee rates on offer from all but a handful of local authorities. As we touch on in the next section, the current proposals for a Health and Social Care Levy will not change this.
We believe that now more than ever, access to accurate self-funded fee data is essential in helping elderly care home operators to benchmark their fees and make their organisations more financially resilient as we build back from the travails of the last eighteen months.
This new report reveals how elderly care home operators have updated their quoted fees for a new financial year across the entire market, compared with 12 months before. We’ve also explored which profile of home has seen the greatest change in quoted fees, as well as examined the impact of COVID-19 mortality rates at an individual home level on changes in quoted fees.
Get the full research report now
Our full research report (PDF) is available by request and explores in thorough detail:
- The changes in national and regional quoted self-funded fees for both nursing care and personal care
- How fees break down by age of home (focusing on the sector’s newest and shiniest assets)
- How COVID-19 mortality rates have impacted on quoted self-funded fees
- What our data can tell us about the typical profile of a home with an Outstanding CQC rating
- How local authority baseline fee rates vary across Great Britain
To request a copy of the full report, please email info@carterwood.co.uk or call 01454 838038.
In this article
This article highlights how self-funded fee rates for nursing and personal care have changed over the past year, comparing data from Q2 2020 and Q2 2021, broken down by country/region.
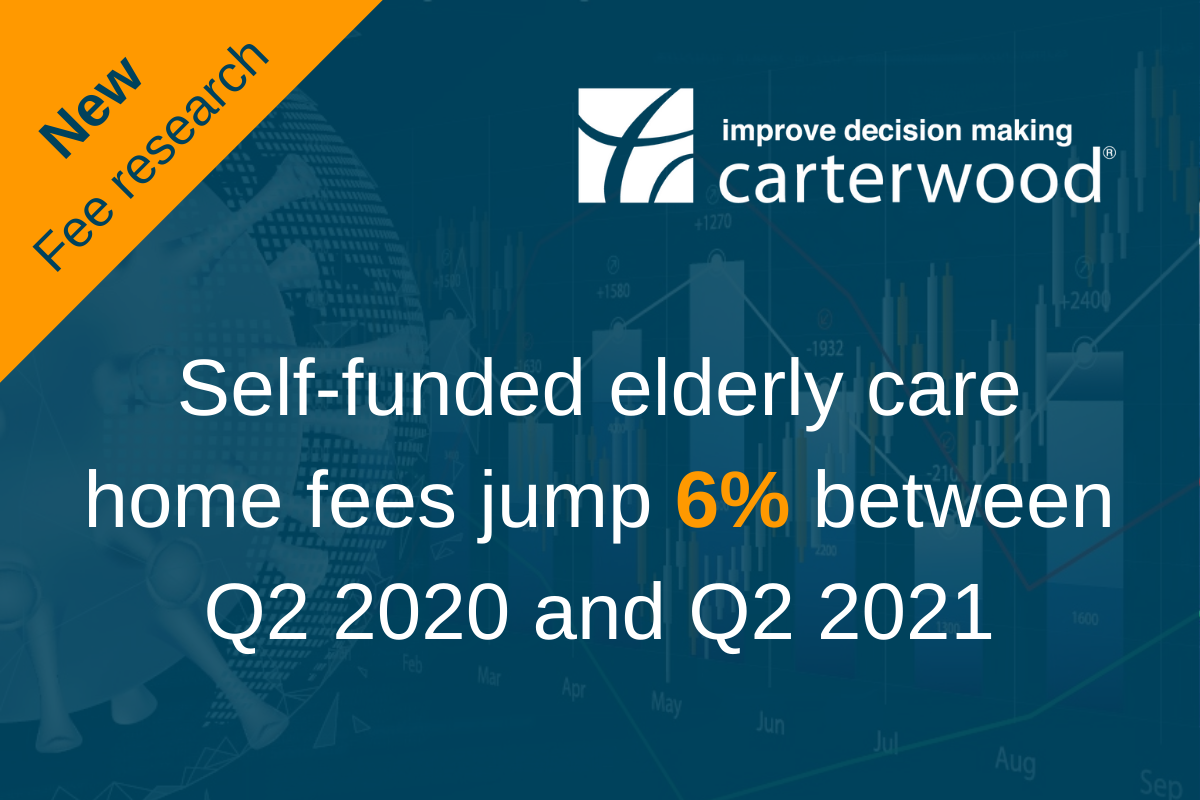
Average GB self-funded nursing care fees are up 6.1%, with personal care fees up 6.6%
Key takeaways:
- Average increase in quoted self-funded fees across Great Britain exceeds historic annual uplifts (circa 5%), potentially driven by higher cost bases as a result of COVID-19
- Average self-funded nursing care fees are up 6.1% to £1,212 p/w
- Average self-funded personal care fees are up 6.6% to £916 p/w
- The biggest fee increases are in London and Scotland
- Regions with the highest weekly nursing care fees show the smallest year-on-year increases
Average quoted self-funded fees across Great Britain are up by 6.1% for nursing care and 6.6% for personal care. This increase exceeds historic annual uplifts, which have tended to sit around the 5% mark.
The table below shows our average quoted self-funded fee rates (Q2 2021) by country/region and the annual uplift from our dataset collected in Q2 2020:
Table 1: Average quoted fee rates by region and care category
| Country/region | Nursing care self-funded fees - Average fee (per week) | Nursing care self-funded fees - % change YoY | Personal care self-funded fees - Average fee (per week) | Personal care self-funded fees - % change YoY |
|---|---|---|---|---|
| East Midlands | £1,139 | 8.7 | £843 | 7.3 |
| East of England | £1,250 | 3.7 | £998 | 5.8 |
| London | £1,415 | 11.3 | £1,125 | 9.1 |
| North East England | £1,021 | 6.4* | £789 | 7.6 |
| North West England | £1,040 | -1.3 | £787 | 5.2 |
| Scotland | £1,176 | 10 | £1,016 | 10 |
| South East England | £1,405 | 4.9 | £1,053 | 4.6 |
| South West England | £1,247 | 4.3 | £983 | 6.7 |
| Wales | £1,059 | 6.5 | £791 | 6.3 |
| West Midlands | £1,204 | 6.3 | £861 | 5.6 |
| Yorkshire & The Humber | £1,110 | 8.9 | £795 | 8.4 |
| GB | £1,212 | 6.1 | £916 | 6.6 |
Please note: Fee data coverage varied by country/region from 77% to 92%, with an overall average of 88%.
* The historic average nursing fee for the North East has been subject to slight revisions on a small number of services to ensure FNC is accounted for in nursing fees.
With average occupancy levels still sitting below pre-pandemic levels (87.5%) at between 80-85% across the sector, you might expect lower demand to suppress fee increases. However, we consider that a significantly higher cost-base (managing infection control processes, recruiting and retaining staff, among others) and inadequate short-term funding provision has left operators with no choice but to increase self-funded fee rates to try and offset financial pressures caused by the COVID-19 pandemic.
Surprisingly, the North West shows a year-on-year decrease in quoted fees for nursing care, with rates reducing by 1.3%. No other country/region has an increase of less than 3.7% (East of England – nursing care), let alone a decrease. However, with 436 homes in our sample in the North West, this outlier stands. We will monitor fees in this region in our next update.
Interestingly, if we exclude London, the regions with the smallest year-on-year increases in nursing care fees (the South East, the South West, and the East of England) are the regions with the highest weekly fees. Each of these regions experienced quoted fee increases of less than 5%, while other areas of Great Britain had average uplifts of 6-10% for nursing care.
The biggest fee increases are in London (11.3% for nursing care) and Scotland (10% for both nursing and personal care).
Request the full research report to find out:
- How fees break down by age of home (focusing on the sector’s newest and shiniest assets)
- How COVID-19 mortality rates have impacted on quoted self-funded fees
- What our data can tell us about the typical profile of a home with an Outstanding CQC rating
- How local authority baseline fee rates vary across Great Britain
To request a copy of the full report, please email info@carterwood.co.uk or call 01454 838038.
Benchmark your fees against your local competitors in seconds
Carterwood Analytics – Elderly Care Homes
Carterwood’s comprehensive fee database is accessible at a local market level via our Carterwood Analytics platform. To find out more just email sales@carterwoodanalytics.co.uk.
Carterwood’s specialist reports for the elderly care home sector
Optimise your elderly care home fees by commissioning a Fee Benchmarking Report from Carterwood’s sector-specialist advisory team. Our unique dataset and deep expertise can unlock growth opportunities across your portfolio. Click here to find out more about our specialist reports or email info@carterwood.co.uk to get in touch with a member of our friendly team.