Authors: Ben Hartley (director), Jessica Stainthorp (senior analyst)
In October 2020 we released our analysis of self-funded fee rates across 9,000+ elderly care homes in Great Britain, equating to 89% of the elderly care homes that accept private referrals. In the time since that report was published, the COVID-19 pandemic has spiralled out of control once again, precipitating a second and third national lockdown.
Costs are up across the sector, while occupancy – one of two main income levers – remains depressed and is forecast to remain below pre-pandemic levels for some time. This has put significant pressure on operators, whose other key commercial lever – fee rates – we explore here with an updated database of rates for approximately 9,300 homes across Great Britain. Our goal is to help elderly care home operators to benchmark their fees and make their businesses more resilient at this challenging time. Every one of these updated rates was sourced between 30 September and 31 December 2020.
This new dataset enables us to compare how self-funded fees changed across Great Britain in the second half of 2020, and to assess the current fee landscape from some new angles.
Our full research report (PDF) is available by request and explores in thorough detail:
- what our data can tell us about the typical profile of a home with an Outstanding CQC rating
- how fees break down by age of home (focusing on the sector’s newest and shiniest assets)
- how local authority baseline fee rates vary across Great Britain.
To request a copy of the full report, please email info@carterwood.co.uk or call 01454 838038.
This article highlights how self-funded fee rates for nursing and personal care changed during the second half of 2020, broken down by country/region.
Average GB self-funded nursing care fees are up 2% to £1,165 p/w, with personal care fees up 1% to £868 p/w
The table below shows our updated average self-funded fee rates (Q4 2020) by country/region and the percentage change from our previous dataset (collected May–August 2020):
| Country/region | Nursing care average self-funded fee (per week) | Change in nursing care average fees | Personal care average self-funded fee (per week) | Change in personal care average fees |
|---|---|---|---|---|
| East Midlands | £1,058 | +1.0% | £806 | +2.6% |
| East of England | £1,230 | +2.0% | £958 | +1.5% |
| London | £1,328 | +4.4% | £1,045 | +1.4% |
| North East England | £849 | −4.8% | £752 | +2.6% |
| North West England | £1,064 | +0.9% | £760 | +1.6% |
| Scotland | £1,123 | +5.0% | £929 | +0.5% |
| South East England | £1,379 | +3.0% | £1,008 | +0.1% |
| South West England | £1,243 | +4.0% | £929 | +0.9% |
| Wales | £970 | −2.5% | £744 | +0.0% |
| West Midlands | £1,108 | −2.2% | £821 | +0.7% |
| Yorkshire | £1,052 | +3.3% | £753 | +2.8% |
| ALL | £1,165 | +2.0% | £868 | +1.0% |
Please note: Fee data coverage varied by country/region from 82% to 92%, with an overall average of 89% in our October study, and from 86% to 93%, with an overall average of 90% in this report.
Key takeaways:
- Average self-funded fees are up slightly at GB level
- Average nursing fees have risen slightly more (2%) than personal care (1%) overall, but have the greatest variation by region/country
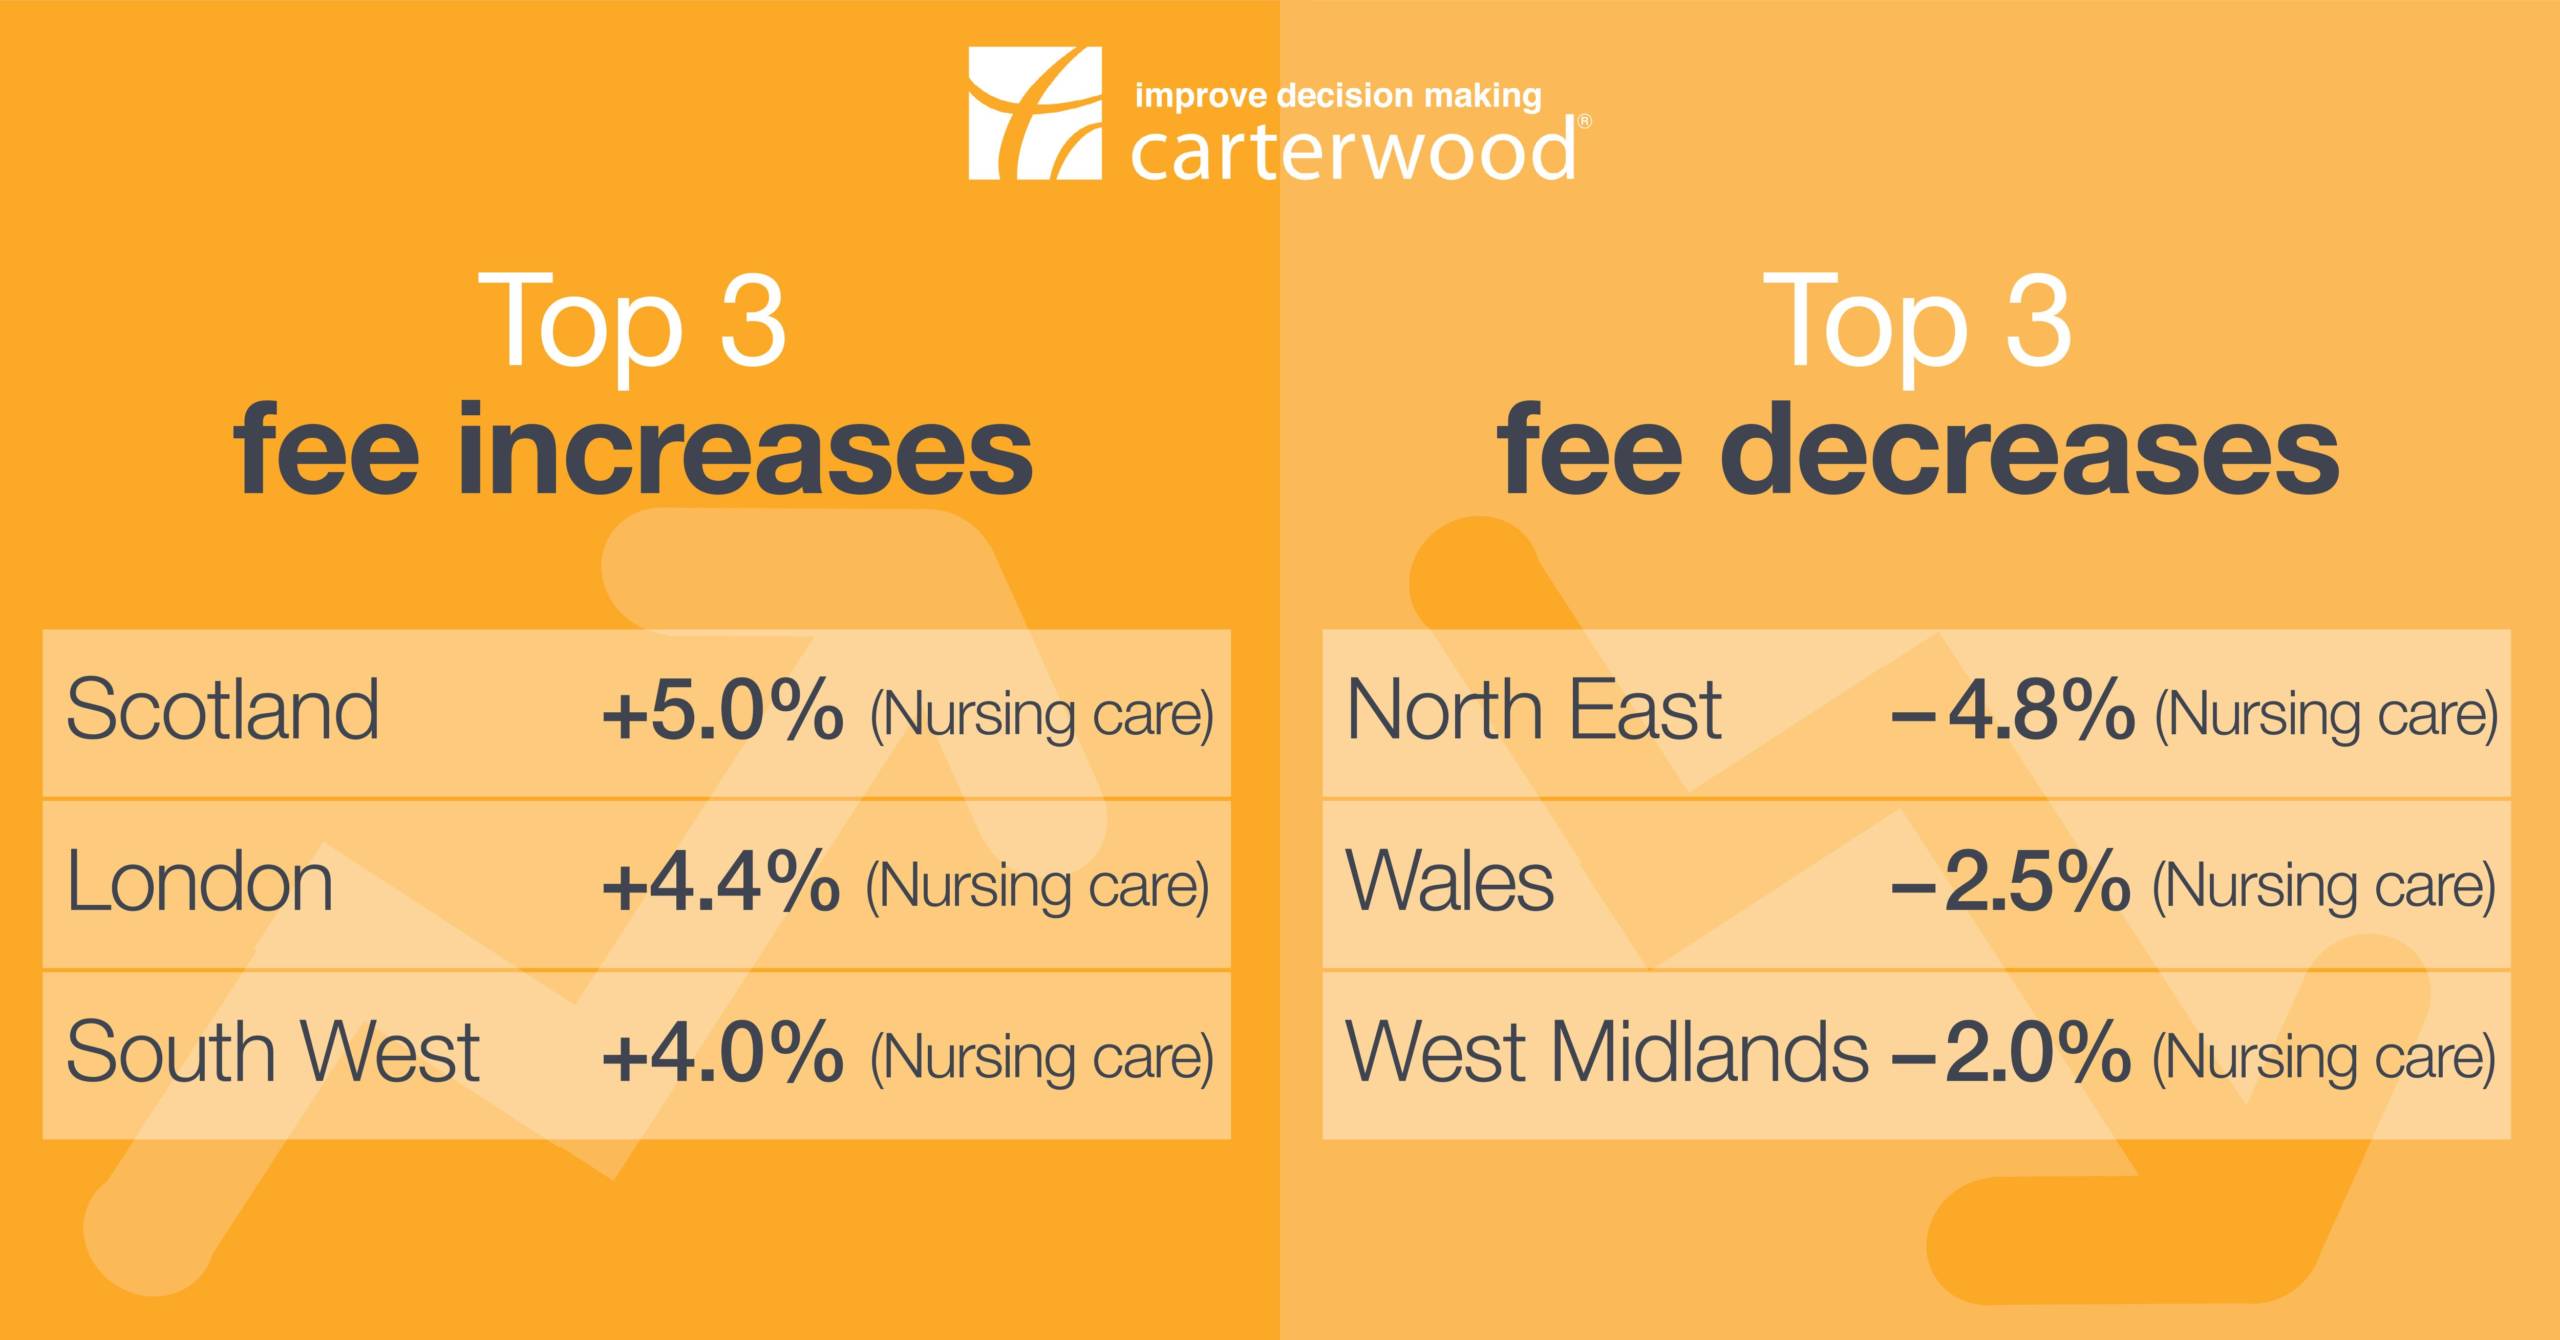
- The biggest fee increase is 5% in Scotland for nursing care and 2.8% for personal care in Yorkshire and the Humber.
- The biggest fee decrease is 4.8% in the North East for nursing care, with no areas showing an overall decrease in personal care fees.
Overall, the impact of COVID-19 on fee rates appears relatively muted. Homes have generally sought to raise fee rates partway through the year, which could be a response to depressed occupancy rates as homes seek to hold firm during the pandemic and not resort to wholesale price cuts that could be difficult to recoup later.
However, it’s also possible that homes are keeping quoted rates at or above historic levels while negotiating larger discounts with individual placements. Over time we may see self-funded fee rates fall as homes seek to compete on price to regain occupancy in the post-vaccine recovery period.
Request our full research report (PDF) to find out:
- what our data can tell us about the typical profile of a home with an Outstanding CQC rating
- how fees break down by age of home (focusing on the sector’s newest and shiniest assets)
- how local authority baseline fee rates vary across Great Britain.
To request a copy of the full report, please email info@carterwood.co.uk or call 01454 838038.
Benchmark your fees against your local competitors in seconds
Carterwood’s comprehensive fee database is accessible at a local market level via our Carterwood Analytics platform. To find out more or book a demo just email sales@carterwoodanalytics.co.uk.