Authors: Ben Hartley, Jessica Stainthorp
This article is part of a series exploring our newly updated database of self-funded fee rates for 9,000+ elderly care homes in Great Britain, equating to 90% of the elderly care homes that accept private referrals.
For background on this research, please see the first article in the series, which focuses on how self-funded fee rates changed over the second half of 2020.
In this article we explore the impact of age of scheme on the self-funded fee rates quoted by operators. We’ve used year of first registration to determine age, and compared self-funded fee rates across age bands for elderly care homes located in England, Scotland, and Wales.
In our October 2020 research, we broke down asset quality into 10-year age bandings. This time, however, we’ve used shorter 5-year age bands that enable us to shine a spotlight on the 300 elderly care homes that were registered between 2016 and 2020 and did not feature in our previous dataset.
The newer the home, the higher the fee
Looking at our improved dataset in these shorter 5-year age bands reveals the significant impact that age/asset quality has on fee rates. As you can see, there is a clear correlation between year of first registration and quoted self-funded fee rates.
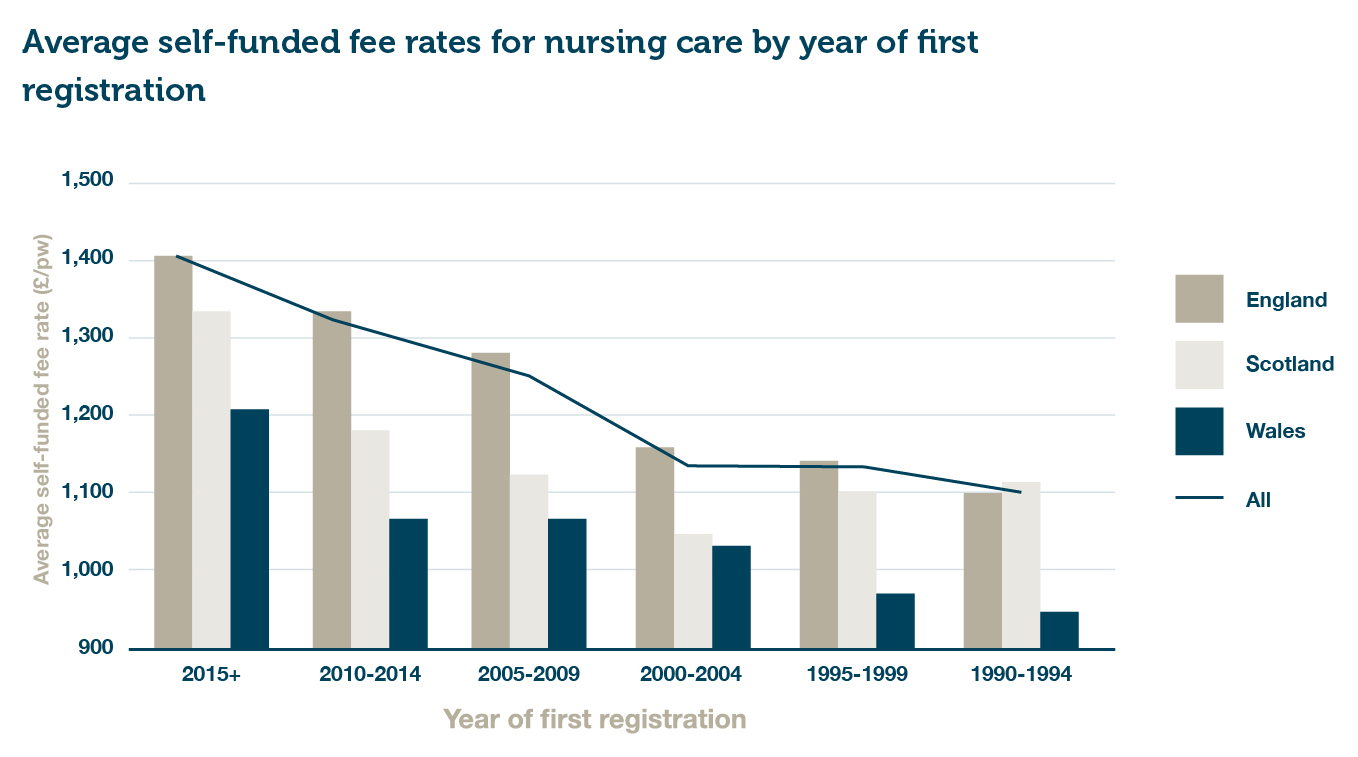

Figure 1 – Mean average self-funded fee rates for nursing care by year of first registration (combined DE/OP)
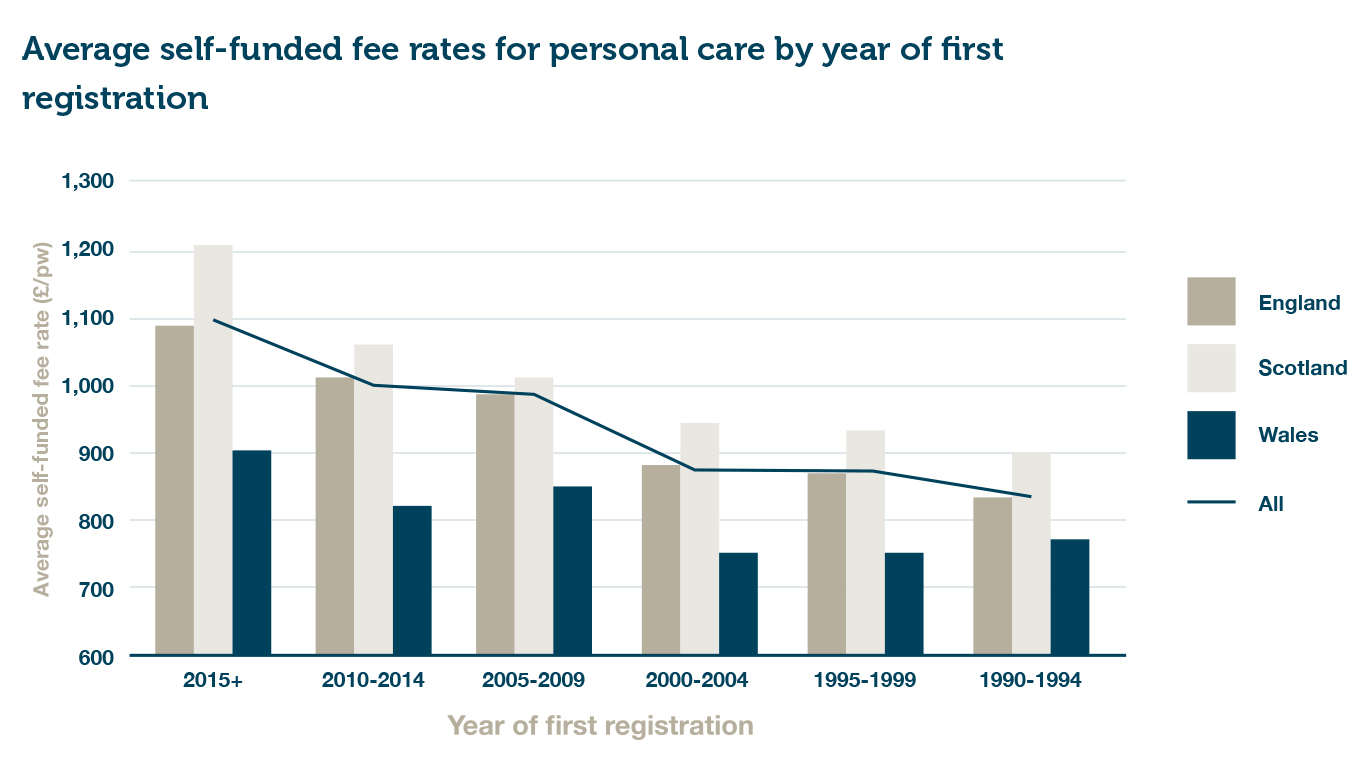
Figure 2 – Mean average self-funded fee rates for personal care by year of first registration (combined DE/OP)
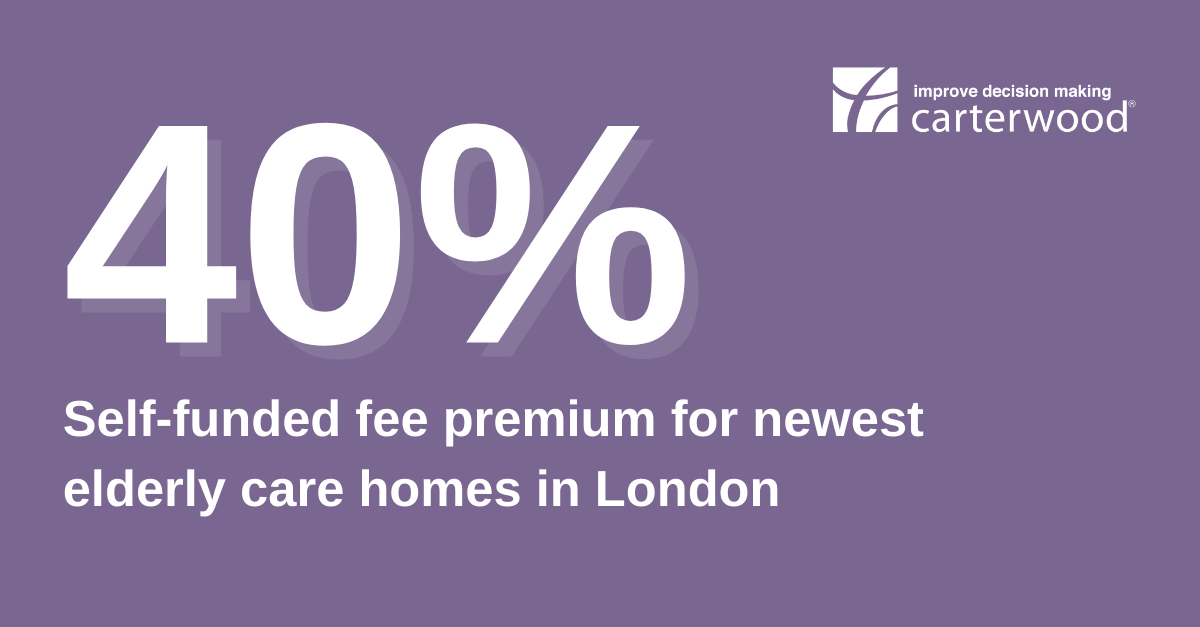
Highest premiums are quoted in London, with a 40% premium for nursing care and 34% for personal care
In order to explore just how significant that fee uplift is for the newest homes, we’ve compared the average self-funded fees being quoted by homes registered after 2015 with the averages for all other homes, broken down by region:
| Country/region | Nursing care self-funded fees: 2015+ homes (per week) | Nursing care self-funded fees: All other homes (per week) | Uplift | Personal care self-funded fees: 2015+ homes (per week) | Personal care self-funded fees: All other homes (per week) | Uplift |
|---|---|---|---|---|---|---|
| East Midlands | £1,213 | £1,051 | 15% | £977 | £793 | 23% |
| East of England | £1,469 | £1,205 | 22% | £1,192 | £941 | 27% |
| London | £1,802 | £1,288 | 40% | £1,371 | £1,022 | 34% |
| North East England | £1,052 | £840 | 25% | £827 | £748 | 11% |
| North West England | £1,203 | £1,052 | 14% | £944 | £749 | 26% |
| Scotland | £1,339 | £1,110 | 21% | £1,217 | £916 | 33% |
| South East England | £1,562 | £1,356 | 15% | £1,321 | £980 | 35% |
| South West England | £1,408 | £1,229 | 15% | £1,156 | £917 | 26% |
| Wales | £1,211 | £966 | 25% | £909 | £760 | 20% |
| West Midlands | £1,286 | £1,088 | 18% | £1,041 | £804 | 30% |
| Yorkshire & The Humber | £1,125 | £1,047 | 7% | £885 | £743 | 19% |
| ALL | £1,396 | £1,148 | 22% | £1,096 | £856 | 28% |
Table 1: Regional fee rates – comparison between 2015+ homes and all other homes
Key takeaways
- Overall, homes registered since the start of 2015 quote premiums of 22% and 28% for nursing care and personal care respectively, when compared to the rest of the dataset. This is broadly in line with our expectations, given the range of facilities and high-end specifications that are common in newer homes.
- The highest premiums are quoted in London, with a huge 40% premium for nursing care and 34% for personal care. We consider that the scale of this differential is due to the most recent new builds in London looking to target the very upper end of the private market. Historically, the London market was neglected due to unserviceable land costs, but more recently care home values at the top end have enabled more operators to unlock this relatively untapped market, and the fee rates bear testament to the underlying housing value in the capital.
- It is interesting that the personal care uplift is greater than the nursing uplift for the newest homes compared to the rest of the stock, and we consider that this is probably being driven by a greater proportion of residential and residential dementia registration in new builds and a move away from nursing care to avoid nurse recruitment and staffing issues. Higher uplifts for personal care in the newest homes are particularly evident in those areas that tend to see high levels of development activity, such as the South East, Scotland, West Midlands, and London.
More information
Request our full research report (PDF) to find out:
- how self-funded fees changed across the market in the second half of 2020
- what our data can tell us about the typical profile of a home with an Outstanding CQC rating
- how local authority baseline fee rates vary across Great Britain.
To request a copy of the full report, please email info@carterwood.co.uk or call 01454 838038.
Benchmark your fees against your local competitors in seconds
Carterwood’s comprehensive fee database is accessible at a local market level via our Carterwood Analytics platform. To find out more just email sales@carterwoodanalytics.co.uk