Authors: Ben Hartley, Jessica Stainthorp
This article is part of a series exploring our newly updated database of self-funded fee rates for 9,300+ elderly care homes in Great Britain, equating to 90% of the elderly care homes that accept private referrals.
This time we focus on the relationship between fees and CQC rating (England only), and reveal a consistent trend in quoted self-funded fee premiums at homes with an Outstanding CQC rating. We also explore the common characteristics of homes rated Outstanding, and debunk some common misconceptions about the type of home that most frequently achieves this top rating.
You can read the previous articles in this series here:
- Self-funded elderly care home fees rise and fall by +5% to -4.8% across Great Britain
- Self-funded fee premium of up to 40% for elderly care homes registered in the last 5 years
Outstanding homes quote 19.7% fee premium over those rated Good
Analysis of our initial self-funded dataset back in October revealed a 20.6% premium in quoted fees at Outstanding homes compared to those rated Good, but overall a minimal differential between homes with lower ratings.
Our analysis of this new Q4 2020 dataset supports our previous finding, with the fee differential between homes rated Outstanding and Good now standing at 19.7%.
The fee differential between Good and Requires improvement has increased slightly to 3.7%, from 3.0% in our previous analysis. As before, there is almost no difference in quoted self-funded fees for homes rated Inadequate and Requires Improvement.
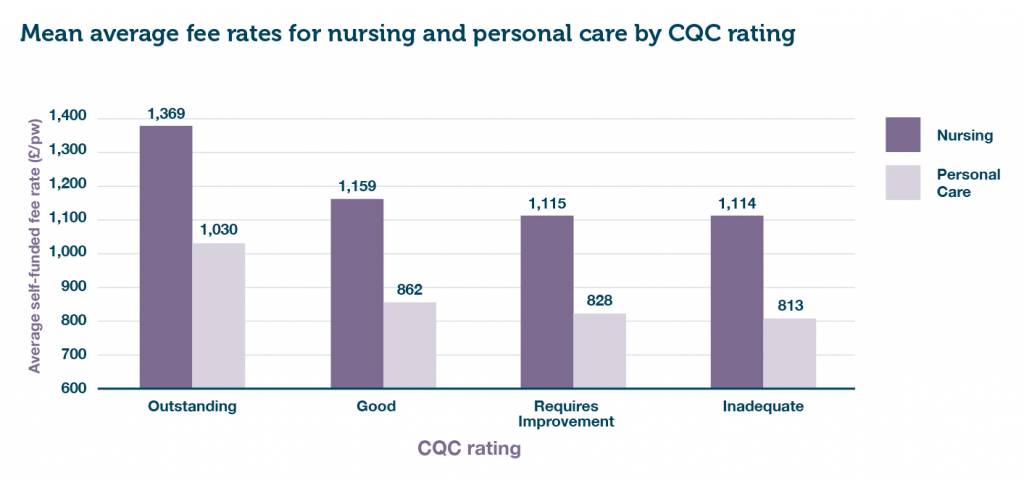
Figure 1: Mean average self-funded fee rates for nursing and personal care by CQC rating (combined OP/DE)
Profiling CQC Outstanding homes
To dig a little deeper into what characteristics might be correlated with an Outstanding rating, we’ve broken down all elderly care homes in England by CQC rating and key asset, ownership, and wealth indicators.
| CQC rating | No. of homes as % of data set | Average home size (total capacity) | % en-suite | % wetroom | Average house price | % homes that are in private ownership | % homes that are top 20 operator |
|---|---|---|---|---|---|---|---|
| Outstanding | 4.4 | 48 | 83 | 45 | 335,574 | 81 | 20.8 |
| Good | 73.1 | 41 | 74 | 26 | 290,770 | 87 | 19 |
| Requires Improvement | 18.9 | 45 | 71 | 24 | 283,592 | 91 | 17.5 |
| Inadequate | 1.5 | 44 | 70 | 23 | 255,385 | 96 | 16.8 |
| Not rated | 2.1 | 58 | 94 | 82 | 313,829 | 92 | 20.9 |
| All homes | 100 | 43 | 74 | 28 | 291,327 | 88 | 18.8 |
Table 1: Asset, ownership, and wealth analysis by CQC rating
Notes: En-suite = WC and wash hand basin / Wetroom = WC, wash hand basin and level access wet bathing facilities
We believe this data upends several commonly held beliefs about the type of elderly care homes that are rated Outstanding:
- Myth 1 – It is easier for a smaller home to be rated Outstanding
Homes rated Outstanding are on average 48 beds in size, which is larger than the average home size of 43 beds for England as a whole. (Please note: Homes classified as “Not rated” are usually much larger than the current average due to typically being new build schemes that are yet to receive their first inspection.)
- Myth 2 – Asset quality doesn’t matter
Although the pool of Outstanding homes includes homes of all varieties, the data clearly indicates that Outstanding homes typically have a greater proportion of en-suite and wetroom bedrooms.
- Myth 3 – Wealth and affluence doesn’t matter
As with asset quality, there are many Outstanding homes located in areas with a modest wealth profile. However, the average house price in the postcode sectors that Outstanding homes across England are located within is significantly higher than the average for those containing homes with lower ratings. Furthermore, there is a clear correlation that suggests that inadequate homes are located in the areas with the most modest underlying housing wealth.
- Myth 4 – Ownership doesn’t matter
Elderly care homes under Not for profit (NFP) ownership comprise 12% of total stock, but account for a disproportionately high 19% of Outstanding homes and disproportionately low 4% of Inadequate homes.
- Myth 5 – Larger corporates get the short end of the rating stick
Our data suggests that the top 20 operators run a higher percentage of homes rated Outstanding than any other rating category.
Overall, the data suggests that the profile of elderly care home most likely to achieve an Outstanding rating is a larger, modern home providing a high proportion of en-suite and/or wetroom beds, located in an affluent area, and run by a larger not-for-profit provider.
Where are CQC Outstanding homes located?
Finally, we wanted to visualise the locations of all homes with an Outstanding CQC rating at the time of research (January 2021). As you can see, there is a wide distribution of homes rated Outstanding across all regions of England.
While there does appear to be a tight concentration in and around London and the South East, this aligns proportionally with population density.
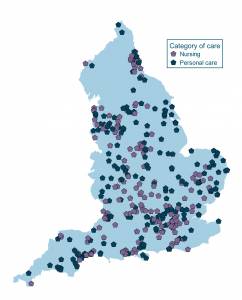
Figure 2: Map showing location of all Outstanding rated homes in England (Purple = Personal care homes / Blue = Nursing care homes)
More information
Request our full research report (PDF) to find out:
- how self-funded fees changed across the market in the second half of 2020
- the difference in self-funded fee rates being quoted by the newest elderly care homes, versus the rest of the market
- how local authority baseline fee rates vary across Great Britain.
To request a copy of the full report, please email info@carterwood.co.uk or call 01454 838038.
Benchmark your fees against your local competitors in seconds
Carterwood’s comprehensive fee database is accessible at a local market level via our Carterwood Analytics platform. To find out more just email sales@carterwoodanalytics.co.uk